In 2016, for the first time in nearly 9 years, the Fed raised its short-term borrowing rate.
History may hold valuable clues for investors who are looking to understand what a rate hike may mean for them.
History may hold valuable clues for investors who are looking to understand what a rate hike may mean for them.
The bottom line is that while a rate hike may mark a turning point in policy and create volatility, it hasn’t historically been an inflection point for investment performance. Instead, the first rate hike has most often come during the mid-phase of the business cycle, a period when most investments have produced positive performance.
Here are some key lessons from the past, based on analysis from Fidelity’s Asset Allocation Research Team (AART). For all the charts that follow, it is worth noting that these results are averages, and in each instance of rate hikes, markets behave differently.
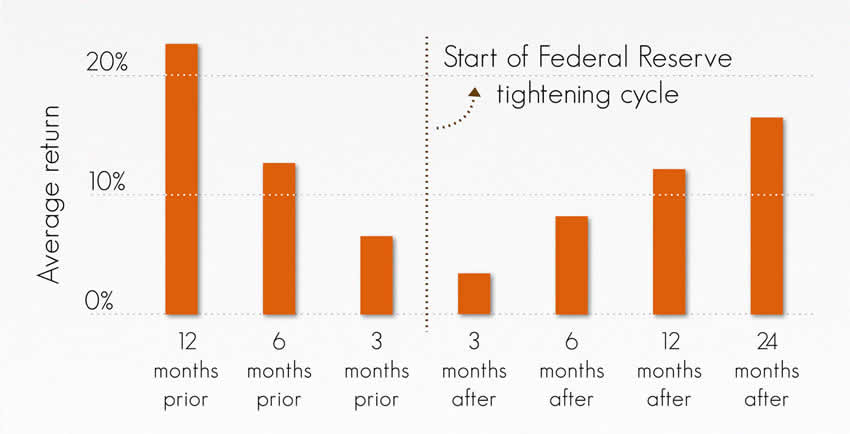
1. Stock gains continue after initial rate move.
While rate hikes may cause volatility, the first rate hike usually takes place during the mid-phase of the business cycle, when profits are strong and the economy is growing. Despite the rate hike, stocks have averaged double-digit gains in the year before and after the first Fed move.

Read the remainder of the report here...

No comments:
Post a Comment