Showing posts with label Bonds. Show all posts

Friday, June 7, 2013

Since 1983, High Yield Has Produced +90% of the Return of Equities with Roughly Half the Risk


High Yield Has Produced +90% of the Return of Equities with Roughly One-Half the Risk


Return & Volatility of High-Yield Bonds & Stocks


High Yield Has Produced 90% of the Return of Equities with Only 60% of the Risk
Sources: Strategic Insight, as of December 31, 2012. Data from June 1983 through December 2012. Past performance is historical and does not guarantee future results. High Yield is represented by the Barclays Capital US High Yield Credit Index; Stocks are represented by the S&P 500 Index.


High Income
Relative to traditional fixed income sectors, high yield bonds offer substantially higher income.

While these bonds generally have lower credit ratings, they're also LESS sensitive to changes in interest rates


This means their price is LESS likely to decline when interest rates and inflation rise, two environments in which traditional fixed income sectors suffer.

This makes the high-yield sector an exceptional hedge and an uncorrelated diversifier for your portfolio.


Best of Both Worlds
High yield securities combine the best characteristics of stocks and bonds.

In fact, high yield bonds have historically generated long-term total returns similar to equities with almost half the volatility.

When compared to traditional fixed income sectors, high yield bonds have provided greater returns, albeit with additional volatility.

This distinct risk/return dynamic makes for a compelling, strategic long-term allocation.


Thursday, September 15, 2011

Are We Headed for A Prolonged Japanese Deflationary Slog?


If you look at the progression of the U.S. stock market boom and bust, it's easy to see comparisons to the long deflationary slog experienced by Japan.

What's more, we have a similar monetary structure (our own currency, with mostly domestically-owned, domestically denominated debt), and we're facing a similar crisis (too much private sector debt).

The Treasury market shows it as well.

The spread between current Treasury yields and yields on Japanese Government Bonds has hit a new multi-decade low.

And beyond that, the progression of the Treasury yield collapse has has gone at a similar pace.

This chart comes from Nomura's Richard Koo, lining up 10-year yields between Japan and the U.S. at the start of each respective crisis.

Bottom Line:

10-year Treasury yields have a lot longer to fall if you think Japan is a good guide. 

Thursday, June 30, 2011

Why A Portfolio Mix of Stocks & Bonds Is Best...


In the last 30 calendar years (1981-2010), a 
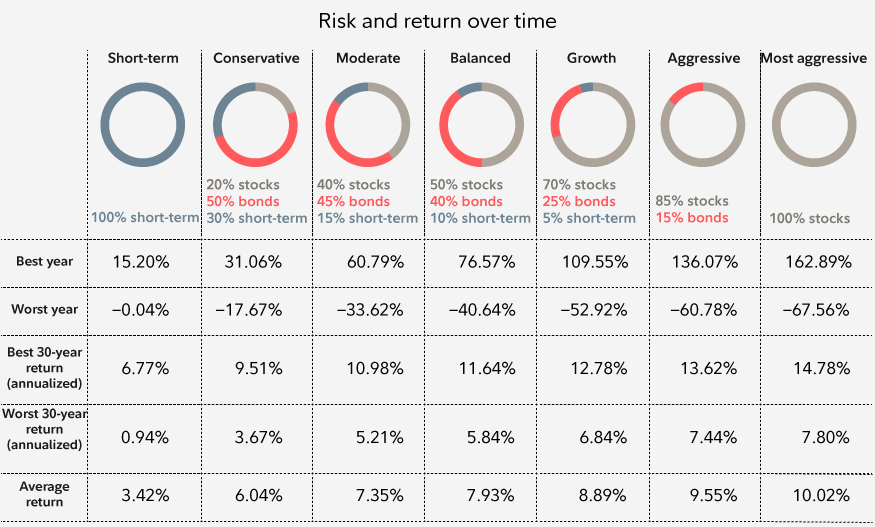
70/30 mix of stocks to bonds (with annual rebalancing) produced an average annual total return of +10.5% (before-tax) with the worst year being a -24.3% loss in 2008.

100% stock portfolio produced a +10.7% average annual total return (before-tax) with the worst year being a -37.0% loss in 2008.

Thus the stock/bond combination 
produced 98% of the return of the all-stock portfolio with less volatility.

Source: BTN Research


Wednesday, April 6, 2011

1st Quarter 2011 Stats: S&P 500, Small Caps, Foreign Stocks, T-Notes


The S&P 500 gained +5.9% in the 1st quarter of 2011.  For all of calendar year 2010, the S&P 500 gained +15.1%.  The S&P 500 has gained an average of +9.7% per year (total return) over the last 50 calendar years (i.e., 1961-2010) (
source: BTN Research).    

As of its end of the
1st quarter closing value (1326), the S&P 500 is still -18% below its all-time closing high of 1565 set on 10/09/07. (source: BTN Research).     

The international stock index
EAFE gained +3.4% YTD (total return) through 03/31/11 and is up +10.4% on a trailing 1-year basis as of the end of the first quarter this year.  The EAFE stock index has bested the S&P 500 on a total return basis in 7 of the previous 10 calendar years.  The EAFE is an unmanaged index that is generally considered representative of the international stock market (source: BTN Research). 

The small-cap
Russell 2000 is up +7.9% YTD (total return) through 03/31/11 and is up +25.8% on a trailing 1-year basis as of that date.  The Russell 2000 index is an unmanaged index of small-cap securities which generally involve greater risks (source: BTN Research).     

The yield on the
10-year Treasury note was 3.46% on 03/31/11.  The yield on the 10-year Treasury note was 8.05% on 03/31/91 or 20 years ago (source: Treasury Department). 


Friday, December 3, 2010

High-Yield Bonds & The Historical Impact of Rising Interest Rates...


Even at historical low yields of about 7%, high-yield corporate debt stacks up favorably against the S&P 500, which has a dividend yield of less than 2%. That means stocks, which are a lot more volatile than bonds, would need to gain at least +5 percentage points of performance just to keep up with a more predictable 7% yield from high-yield bonds.


Historically, high-yield bonds have not been as sensitive to interest rate increases as investment-grade bonds and treasury bonds.


For example, one of the biggest threats to fixed income right now is that a sudden spike in interest rates — currently at historic low levels — would further wipe out returns. According to an analysis of the biggest interest rate moves over the 20-year period through June 2006, high-yield bonds are remarkably resilient against interest rate volatility.


Between September 1987 and June 2006, there were six separate 12-month periods that saw the yield on the 10-year Treasury climb by between +117 and +222 basis points.

The average total return of high-yield bonds for those same 12-month periods was +5.5%, with just one negative-return period.


In comparison, the average total return for investment-grade corporate bonds over the same periods was a loss of -0.1% ,  including three negative-return periods.


Of the six 12-month periods, the worst performance for high-yield bonds was a decline of -1.57% in 1994, when the Treasury yield climbed by +204 basis points. Over the same period, investment-grade bonds fell by -3.34%.


The best 12-month period for high yield was through May 2004 when the bond category gained +13.23% on a 130-basis-point gain in the Treasury yield. Investment-grade bonds over the same period fell by -0.47%.


One of the main reasons high-yield bonds are able to weather interest rate volatility is the yield “cushion,” according to Sabur Moini, manager of the $1 billion Payden High Income Fund (PYHRX). For example, the current 6.8% average yield on high-yield bonds compares with a 3.8% average yield on investment-grade bonds.


“The bigger yield cushion makes high-yield bonds a lot less interest-rate-sensitive,” Mr. Moini said.

“Typically, low growth, but not in a recession, is the best environment for high-yield bonds,” said Michael Collins, co-manager of the $700 million Prudential Total Return Bond Fund (PDBAX). A little bit of inflation and projected economic growth in the +2% to +2.5% range “is almost the sweet spot for high yield,” he said.


Thursday, December 2, 2010

Study: 2 Out of 3 Americans Flunk Finance Quiz...


Most Americans have an inadequate understanding of financial products and concepts, according to a new study
 conducted by Mathew Greenwald & Associates, Inc., Washington.

T
he research revealed that 69%! would receive a failing grade on a quiz about financial products and concepts.

When asked to rank the importance of understanding their own personal finances, 79% gave it a 7 or above on a scale of 1 (“What I don’t know won’t hurt me.”) to 10 (“I feel the need to know all I can about my financial situation.”).


Among the report’s other findings:


35% of respondents knew that the average rate of inflation is closer to 3% than 6% or 9%.


50% believed (incorrectly) that bonds offer the best protection against inflation compared to stocks.


32% knew that index funds seek to match the returns of stock or bond benchmarks, but 34% acknowledged they had no knowledge of how index funds work.


35% knew that money market funds are comprised of short-term investment vehicles.

27% realized that permanent life insurance can pay dividends.

49% believed (incorrectly) that term life insurance is more likely to have cash value than permanent life insurance.


57% thought annuities were only sold by banks.


61% thought Social Security funds are invested in the stock market!!!


44% did not realize they paid into Social Security!!!


Tuesday, August 31, 2010

Why Market Risk May Be Higher Than You Think: Reason #2 of 5...

2. The Fed is nervous.

In August the Fed warned that the economy had weakened, and it unveiled its latest weapon in the war against deflation: using the proceeds from the sale of mortgages to buy Treasury bonds. That should drive down long-term interest rates. Great news for mortgage borrowers. But hardly something one wants to hear when the Dow Jones Industrial Average is already north of 10000.

Tuesday, August 3, 2010

High-Yield Funds Take Big Inflows

High-yield bond funds took in nearly $1 billion for the week ending July 28 for the 3rd largest weekly inflow of the year, according to a report published by Lipper FMI.

Junk bonds funds took in $976 million for the week ending July 28, the third straight week of inflows. This brings the 4-week average to almost $700 million, the largest since May 2009.

High-yield funds have taken in a total of $3.64 billion for the year and have had positive flows for 5 of the last 7 weeks.


Tuesday, March 9, 2010

Consensus Bond Allocation @ 31%


Below we highlight the consensus strategist recommended bond allocation since 1997. At the moment, Wall Street strategists are collectively recommending a 30.5% weighting in bonds.

Prior to the run-up in Treasuries during the financial crisis, the recommended bond weighting fluctuated from 15%-20%. As bond prices rallied, strategists followed them higher by increasing their recommended weighting.

As shown in the chart, the recommended bond weighting peaked well after the long bond peaked in December 2008, and the weighting has been drifting lower throughout the current bull market in stocks.

Over the last few weeks, the recommended bond weighting has remained right around 30%. The long bond itself is currently trading in a range that it typically traded in during the '03-'07 stock market rally, but at 30%, the recommended weighting is about 10 percentage points higher than it was during that time.

Have analysts become more conservative in general, or will the recommended weighting continue to fall as long as the market goes up?

Chart and analysis courtesy of Bespoke Investment Group

Tuesday, January 12, 2010

High-Yield Bonds Continue To Outperform


Over the past month or so, the only area of the bond market that has done well is junk.

  
Both Treasuries and investment grade corporates have struggled, while high yield bonds have continued to surge.

Below we highlight a 6-month performance chart of the high yield bond ETF (HYG) and the investment grade corporate bond ETF (LQD).

As shown, HYG is up +18.2% over the last six months, while LQD is only up +5.5%.

You can see a clear split in performance (shaded in gray) at the start of December, where HYG continued to trade higher and LQD began to trade lower.


Chart and analysis courtesy of Bespoke Investment Group


Friday, December 11, 2009

Q&A: Pimco's Mohamed El-Erian - Courtesy of Fortune Magazine

Pimco's CEO says individual investors must change their investing style, such as being less U.S.-centric.
By Geoff Colvin, senior editor at large

Pimco, the world's largest bond investor, has benefited from investors' flight to quality over the past two years and now manages about $1 trillion in assets.

Mohamed El-Erian, 51, is still thinking large and deep thoughts; his book, "When Markets Collide: Investment Strategies for the Age of Global Economic Change," won the Financial Times Goldman Sachs business book of the year award last year.
 
Mr. El- Erian sat down recently with Fortune's Geoff Colvin to talk about threats to individual investors, the best framework for an investment portfolio, how the 2008 financial meltdown was like a double-drive-through McDonald's, and much else.

 Here's a sampling of  some of the questions....

We've had one quarter of solid economic growth. Is the recession over?

Why are a lot of very positive things unlikely to occur for the consumer?

If American consumers start saving more, isn't that a good thing?

From the perspective of an individual investor, is the multipolar world a good thing or a bad thing?

What are the most important things that individual investors need to do differently?

What's the best protection for an individual investor against inflation?

In your book you present an asset allocation for a typical U.S. investor. Only 15% is in U.S. equities, which is much less than most U.S. investors hold. And only 14% is in bonds, U.S. and non-U.S., which seems like not very much. What's the logic?

You've said that this asset allocation -- which includes many other elements [see table] -- could be expected to return +5% to +7% a year in real terms over the long run. Many investors believe that U.S. equities will return much more over time. Is that just not correct?

A lot of new financial regulation is in the works. Is it going to be, as it so often is, regulation that will prevent the crisis that just happened and not regulation that will prevent the next crisis?

After the September 2008 crisis, you mentioned in Fortune that you'd asked your wife to withdraw cash from the bank. What was your life like?

What's your bottom line advice to individual investors in today's environment?


Full Interview - Click Here: Investing Advice from Mohamed El-Erian: Q&A with Fortune - Dec. 10, 2009