Showing posts with label stock market. Show all posts

Wednesday, March 23, 2016

Wednesday, August 20, 2014

Vanguard's 10-Year Investment Forecast Predicts a +5.7% per Year Real Return


Excerpt:

"Vanguard predicts a most likely case of a +5.7% real annual returns for stocks, but other experts are more cautious.

In his new book, Rational Expectations, William J. Bernstein predicts a +2% real return for large-cap stocks and +3% for small-cap stocks over the next decade.

Rob Arnott, chairman of Research Affiliates, forecasts a +3% real return over the next decade."


My own opinion is that the future is even more uncertain than the ranges shown in the Vanguard model — especially on the downside.

And as I see it, the world is a less predictable place than ever before.


Read the entire report here...

Vanguard Capital Markets Model: 10-Year Investing Forecast


Friday, May 16, 2014

The Average NASDAQ and Russell 2000 Stock is Already In A Bear Market

cotd average stock bear market


There are no perfect stock market indexes that'll give you a complete picture of the state of the market.

Most market-watchers prefer the S&P 500 over the Dow Jones Industrial Average. But the fact that the S&P 500 is with striking distance of its all-time high of 1,897 belies the fact that many stocks in the index and in the market as a whole are way down.

"When we examine breadth in terms of new highs, more specifically stocks that are in ‘striking distance’ to a new high, we see a completely different picture," writes J.C. O'Hara, of FBN Securities. "Often at the end of bull markets, large cap stocks continue to rise and the smaller stocks begin to flatter."

The S&P 500 is cap-weighted, which means larger companies like Apple and ExxonMobil have a much larger impact on how the index moves.

"High cap stocks influence the averages more thus can mask internal weakness," continued O'Hara.

O'Hara's research found that the average S&P 1500 stock is down by more than -12% from their recent 52-week highs. The average stocks in the Russell 2000 and Nasdaq Composite are down by more than -20%, which means you can say they are in bear markets.

"Historically, this sort of divergence does not bode well for the longevity of a market’s upward inertia," said O'Hara. "We went back and examined instances where the market made a new high and looked at where the median stock sat compare to its high. Our data suggests that the current breadth reading is very unhealthy. Not only are new highs diminishing but we are seeing many stocks making new lows. This breadth divergence is a major concern."

O'Hara says this isn't necessarily a screaming sell signal.

"However the powerful message of “there is something wrong” should not go unnoticed," he cautions.


Read more: The Average NASDAQ and Russell 2000 Stock is Already In A Bear Market


Friday, January 10, 2014

Chart of The Day: The Dow's Average Year vs Its Average Mid-Term Election Year

Chart of the Day


Today's chart illustrates how the stock market has performed during the Average Mid-Term Election Year versus the average year.

Since 1950, the First 9 Months of the
Average Mid-Term Election Year have tended to be Subpar (see thick blue line).

That subpar performance was then followed by a significant year-end rally.
 

One theory to support this behavior is that investors abhor uncertainty. To that end, investors tend to pull back prior to an election when the outcome is unknown.

Beginning in early October, however, the outcome of the election becomes increasingly apparent and investors respond by positioning their portfolios accordingly.


Chart & Analysis Courtesy of Chart of The Day


Friday, August 30, 2013

There's An Incredibly High Correlation Between Stock Market Performance & A Decreasing Trend in Jobless Claims...


spclaims


“As go Jobless Claims, so shall go the Stock Market.” 


“As goes the Stock Market, so shall go Jobless Claims.”


Friday, August 9, 2013

This Disconnect Can't Be Good for Stocks: GDP Tumbles While Stocks Soar?

cotd gdp stocks


The S&P 500 closed at an all-time high on Friday, August 2nd.

Meanwhile, estimates for U.S. GDP Growth in 2013 have been FALLING for two and a half years!

How can this disconnect be good for stocks?


Read more: http://www.businessinsider.com/gdp-growth-expectations-vs-the-sp-500-2013-8#ixzz2b8b4GYOb


Thursday, February 14, 2013

Is A Period Of Low Stock Market Returns Ahead?

chart of the day, shiller pe results, january 2013


The Shiller PE Ratio, or the cyclically-adjusted price-earnings ratio, may be the most respected measure of stock market value.

In short, the Shiller PE is the price of the stock market divided by the average of ten years worth of earnings.  If the ratio is above the long-term average, the stock market is considered expensive.

Credit Suisse's Andrew Garthwaite compiled the annualized trailing 5-year returns based on certain levels of the Shiller PE
As expected, the lower the ratio, the better the returns.  But the relationship isn't exactly linear.
Here's Garthwaite's chart. 

At current elevated levels, the Shiller PE is signaling a period of low returns, below +5% annually.


Read more: http://www.businessinsider.com/chart-shiller-pe-returns-2013-1#ixzz2HQXyR0xZ

Wednesday, December 12, 2012

Why The Average Investor Is Absolutely Abysmal At Investing...


Just how BAD is the average investor at investing? 


According to 
BlackRock's chart of the week...
They're so bad that they've managed to underperform every major asset class for the last 20 years. 


They've even underperformed inflation!


Volatility is often the catalyst for poor decisions at inopportune times. Amidst difficult financial times, emotional instincts often drive investors to take actions that make no rational sense but make perfect emotional sense.

Psychological factors such as fear often translate into poor timing of buys and sells. Though portfolio managers expend enormous efforts making investment decisions, investors often give up these extra percentage points in poorly timed decisions.

As a result, the average investor underperformed most asset classes over the past 20 years. Investors even underperformed inflation by 0.5%.

Friday, May 25, 2012

It's Deja Vu All Over Again for The Stock Market in 2012...


The stock market forms a triple in top in 2011 and repeats the pattern this year in 2012.


Wednesday, November 9, 2011

2011 Dalbar Study: Why The Average Equity Fund Investor Will ALWAYS Trail The Market...


From December 31, 1990 to December 31, 2010, the S&P 500 gained +9.1% per year.

But the average equity fund investor has gained less than half of much, only +3.8%!

During the same period, the typical aggregate bond index gained +6.9% per year.

But the average fixed income investor has earned 7 times less!!!, only +1.0%!


BOTTOM LINE:


1. Sadly, over the past 2 decades, investors haven't built any real wealth during neither the past 10 years nor the past 20 yearsTaxes, inflation, fear, greed, the business cycle, financial crises and market meltdowns all conspired to, not grow, and not even maintain, but shrivel the purchasing power of the average investor.

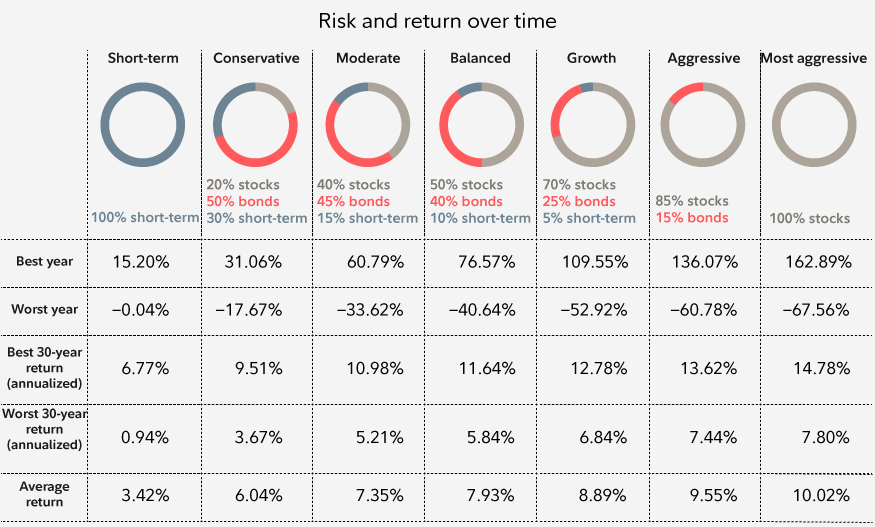
2. The vast majority of passive investors simply don't have and never will have the psychological discipline to keep the faith during bear markets meltdowns of -30%-40% or -50% that decimate their retirement nest eggs.


And who can blame them?


Thankfully, there is a better way.

Thursday, September 22, 2011

Bearish Omen for The Stock Market: Copper Drops to New Lows


Chart and article excerpts courtesy of Investors Business Daily

Copper, the so-called red metal with a Ph.D. in economics is used to gauge global activity because it's found in all facets of everyday life, from consumer electronics to building infrastructure. Like most commodities, copper has fallen amid the dollar's newfound strength the past month, owing to safe-haven buying spurred by the European debt crisis.

Tom McClellan, editor of the McClellan Market Report, wrote in his Sept. 16 newsletter that "copper's failure to rally along with the stock market suggests the market will likely give back its gains."

"The global economy is still quite weak, particularly here in the U.S.," said Bill Strazzullo, a partner and chief market strategist at Bell Curve Trading. "We believe you will see the S&P 500 trading around 1000 to 950 and the Dow at 9400 to 9000."

Read the entire Investor Business Daily report here...
Copper ETFs Hit New Low, A Bad Omen For Stocks


Tuesday, July 19, 2011

Why The Average Equity Fund Investor Will ALWAYS Trail The Market...


From January 1, 1990 to December 31, 2009, the S&P 500 gained +8.2% per year.

But the average equity fund investor has gained less the half of much, only +3.2%!

During the same period, 
the typical aggregate bond index gained +7.1% per year.

But the average fixed income investor has earned 7 times less!!!, only +1.0%!

BOTTOM LINE:

1.
 Sadly, over the past 2 decades, investors haven't built any real wealth during neither the past 10 years nor the past 20 years. Taxes, inflation, fear, greed, the business cycle, financial crises and market meltdowns all conspired to, not grow, and not even maintain, but shrivel the purchasing power of the average investor.


2.
 The vast majority of passive investors simply don't have and never will have the psychological discipline to keep the faith during bear markets meltdowns of -30%-40% or -50% that decimate their retirement nest eggs.


And who can blame them?

Thankfully, there is a better way.