Showing posts with label stocks. Show all posts

Friday, April 10, 2015

Since 1950, April has Been the Best Month for Stocks!


Chart of the Day


Today's chart presents the Dow's average performance for each calendar month since 1950 (blue columns). As today's chart illustrates, it is not unusual for the stock market to perform well during the early part of the year.

Looking forward, the averages favor a continued stock market rally as the calendar month of April has been the best month for stocks since 1950, averaging nearly +2.0 percent.

After that, however, things tend to get a little dicier.

Of the five calendar months that follow the strongest month of April, four rank as the weakest average calendar month performers since 1950.


Read more here...
http://www.chartoftheday.com/20150401.htm?H


Wednesday, August 20, 2014

Vanguard's 10-Year Investment Forecast Predicts a +5.7% per Year Real Return


Excerpt:

"Vanguard predicts a most likely case of a +5.7% real annual returns for stocks, but other experts are more cautious.

In his new book, Rational Expectations, William J. Bernstein predicts a +2% real return for large-cap stocks and +3% for small-cap stocks over the next decade.

Rob Arnott, chairman of Research Affiliates, forecasts a +3% real return over the next decade."


My own opinion is that the future is even more uncertain than the ranges shown in the Vanguard model — especially on the downside.

And as I see it, the world is a less predictable place than ever before.


Read the entire report here...

Vanguard Capital Markets Model: 10-Year Investing Forecast


Friday, August 9, 2013

This Disconnect Can't Be Good for Stocks: GDP Tumbles While Stocks Soar?

cotd gdp stocks


The S&P 500 closed at an all-time high on Friday, August 2nd.

Meanwhile, estimates for U.S. GDP Growth in 2013 have been FALLING for two and a half years!

How can this disconnect be good for stocks?


Read more: http://www.businessinsider.com/gdp-growth-expectations-vs-the-sp-500-2013-8#ixzz2b8b4GYOb


Thursday, January 31, 2013

10 Biggest Retirement Mistakes: #4. Mishandling Company Stock


Rolling your 401(k) into an IRA is generally a good idea, but it may not be the right decision when you own highly appreciated company stock inside your plan.

A special rule for what is called “net unrealized appreciation” allows you to move your employer’s stock out of your 401(k) when you retire or leave your job.

You must follow the rules precisely to take advantage of lower capital gains rates, rather than ordinary income taxes, when you sell the stock.


Wednesday, December 12, 2012

Why The Average Investor Is Absolutely Abysmal At Investing...


Just how BAD is the average investor at investing? 


According to 
BlackRock's chart of the week...
They're so bad that they've managed to underperform every major asset class for the last 20 years. 


They've even underperformed inflation!


Volatility is often the catalyst for poor decisions at inopportune times. Amidst difficult financial times, emotional instincts often drive investors to take actions that make no rational sense but make perfect emotional sense.

Psychological factors such as fear often translate into poor timing of buys and sells. Though portfolio managers expend enormous efforts making investment decisions, investors often give up these extra percentage points in poorly timed decisions.

As a result, the average investor underperformed most asset classes over the past 20 years. Investors even underperformed inflation by 0.5%.

Wednesday, November 9, 2011

2011 Dalbar Study: Why The Average Equity Fund Investor Will ALWAYS Trail The Market...


From December 31, 1990 to December 31, 2010, the S&P 500 gained +9.1% per year.

But the average equity fund investor has gained less than half of much, only +3.8%!

During the same period, the typical aggregate bond index gained +6.9% per year.

But the average fixed income investor has earned 7 times less!!!, only +1.0%!


BOTTOM LINE:


1. Sadly, over the past 2 decades, investors haven't built any real wealth during neither the past 10 years nor the past 20 yearsTaxes, inflation, fear, greed, the business cycle, financial crises and market meltdowns all conspired to, not grow, and not even maintain, but shrivel the purchasing power of the average investor.

2. The vast majority of passive investors simply don't have and never will have the psychological discipline to keep the faith during bear markets meltdowns of -30%-40% or -50% that decimate their retirement nest eggs.


And who can blame them?


Thankfully, there is a better way.


Tuesday, July 19, 2011

Why The Average Equity Fund Investor Will ALWAYS Trail The Market...


From January 1, 1990 to December 31, 2009, the S&P 500 gained +8.2% per year.

But the average equity fund investor has gained less the half of much, only +3.2%!

During the same period, 
the typical aggregate bond index gained +7.1% per year.

But the average fixed income investor has earned 7 times less!!!, only +1.0%!

BOTTOM LINE:

1.
 Sadly, over the past 2 decades, investors haven't built any real wealth during neither the past 10 years nor the past 20 years. Taxes, inflation, fear, greed, the business cycle, financial crises and market meltdowns all conspired to, not grow, and not even maintain, but shrivel the purchasing power of the average investor.


2.
 The vast majority of passive investors simply don't have and never will have the psychological discipline to keep the faith during bear markets meltdowns of -30%-40% or -50% that decimate their retirement nest eggs.


And who can blame them?

Thankfully, there is a better way.

Thursday, June 30, 2011

Why A Portfolio Mix of Stocks & Bonds Is Best...


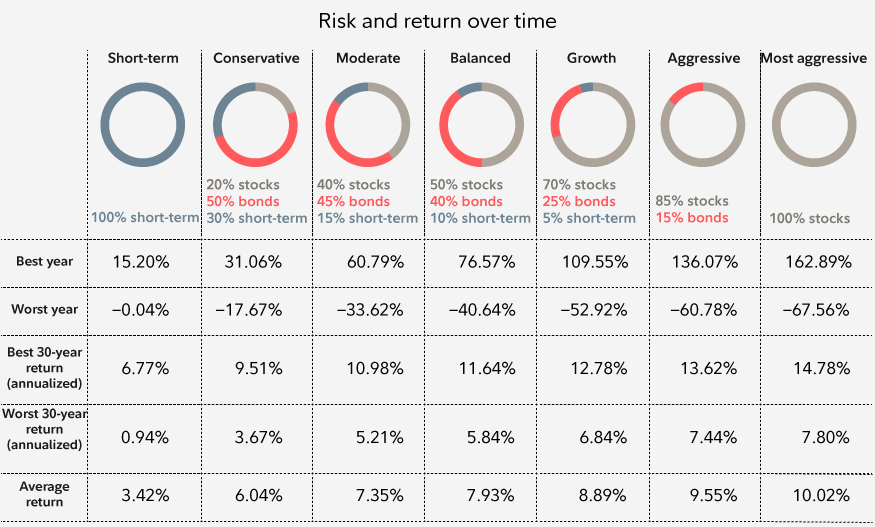
In the last 30 calendar years (1981-2010), a 
70/30 mix of stocks to bonds (with annual rebalancing) produced an average annual total return of +10.5% (before-tax) with the worst year being a -24.3% loss in 2008.

100% stock portfolio produced a +10.7% average annual total return (before-tax) with the worst year being a -37.0% loss in 2008.

Thus the stock/bond combination 
produced 98% of the return of the all-stock portfolio with less volatility.

Source: BTN Research


Wednesday, June 29, 2011

Why 2011 May Be A Middling Year...


The S&P 500 enjoyed double digit returns in 2009 and 2010.

A 3rd consecutive year of double-digit gains, however, would be an anomaly.

Since World War II, there have been 10 back-to-back double-digit advances.

Only twice (1951 and 1994) did the streak run to a 3rd year, and the average return in the 3rd year was only +1.7%.


Thursday, January 6, 2011

The Case for An Up Stock Market in 2011...


This year (2011) will be the 3rd year of Barack Obama's 4-year presidential term that began in January 2009

The S&P 500 stock index has posted a positive total return during the last 17 "presidential 3rd years." 

The last time the S&P 500 was negative during a "presidential 3rd year" was 1939! 

The average annual return of the S&P 500 during a "presidential 3rd year" since 1950 is a gain of +22.0%!


Source: BTN Research


Thursday, December 2, 2010

Study: 2 Out of 3 Americans Flunk Finance Quiz...


Most Americans have an inadequate understanding of financial products and concepts, according to a new study
 conducted by Mathew Greenwald & Associates, Inc., Washington.

T
he research revealed that 69%! would receive a failing grade on a quiz about financial products and concepts.

When asked to rank the importance of understanding their own personal finances, 79% gave it a 7 or above on a scale of 1 (“What I don’t know won’t hurt me.”) to 10 (“I feel the need to know all I can about my financial situation.”).


Among the report’s other findings:


35% of respondents knew that the average rate of inflation is closer to 3% than 6% or 9%.


50% believed (incorrectly) that bonds offer the best protection against inflation compared to stocks.


32% knew that index funds seek to match the returns of stock or bond benchmarks, but 34% acknowledged they had no knowledge of how index funds work.


35% knew that money market funds are comprised of short-term investment vehicles.

27% realized that permanent life insurance can pay dividends.

49% believed (incorrectly) that term life insurance is more likely to have cash value than permanent life insurance.


57% thought annuities were only sold by banks.


61% thought Social Security funds are invested in the stock market!!!


44% did not realize they paid into Social Security!!!


Friday, October 8, 2010

The Average Equity Fund Investor Trails the Market By A Wide Margin...


"A study by research firm 
Dalbar Inc. reveals that for the 20 years ending December 31, 2009, annualized returns for the S&P 500 index were +8.2%, but returns for the average stock (equity fund) investor were only +3.2%."


U.S. News & World Report, October 2010 Issue


A +8.2% per year average return means that a $100,000 investment in the S&P 500 grew to $483,666 over 20 years

But the average equity fund investor only earned +3.2% per year. Under that scenario, 
$100,000 grows to only $187,756 in 20 years.

But wait. Are we done yet?

What about inflation?

We have to account for the fact that inflation averaged +2.8% during the past 20 years. That means that $100,000 has to grow to $173,015 over 20 years just maintain its purchasing power!


What about taxes?

Because investors were buying high and selling low, they incurred tax liabilities that would reduce their inflation-adjusted and tax-adjusted returns below the rate of inflation.

That means the average investor's purchasing power after taxes,  inflation and a +3.2% annual return has not increased, rather it has steadily eroded.


Another
"average investor" study by TrimTabs Investment Research shows that the stock market ended the past decade pretty much at break even, but average investors lost roughly -$39 billion, or roughly -20% over the past 10 years.

"It cost them about
-20% to buy high and sell low," says TrimTabs' Vincent Deluard.


BOTTOM LINE: 

1.
 Sadly, over the past 2 decades, investors haven't built any real wealth during neither the past 10 years nor the past 20 years. Taxes, inflation, fear, greed, the business cycle, financial crises and market meltdowns all conspired to, not grow, and not even maintain, but shrivel the purchasing power of the average investor.


2. The vast majority of passive investors simply don't have and never will have the psychological discipline to keep the faith during bear markets meltdowns of -30%, -40% or -50% that decimate their retirement nest eggs. 


And who can blame them?


Thankfully, there
is a better way.


Tuesday, November 10, 2009

Stock / Bond Ratio Protects Your A$$ets from Bear Markets!

The following will give you a historical and visual perspective of why, at the end of November 2007, we SOLD Stocks and BOUGHT Bonds.
In the chart below we compare the performance of Stocks versus Bonds


Charts courtesy of www.StockCharts.com

After the RED line crosses ABOVE the BLUE line, we become BULLISH on Stocks. We SELL Bonds and BUY Stocks.

After the RED line crosses BELOW the BLUE line, we become BEARISH on Stocks. We SELL Stocks and BUY Bonds.

1. SELL Stocks and BUY Bonds...

From November 30, 2007 to June 30, 2009, the RED line trades below the BLUE line and the S&P drops from 1481 to 919, a gut-wrenching -37.9% plunge and an ENTIRE bear market is AVOIDED!


2. SELL Bonds and BUY Stocks...

From June 30, 2009, to October 30, 2009, the RED line trades above the BLUE line and the S&P jumps from 919 to 1036, a rally of +12.7%.  

Buy-&-Hold-&-Hope S&P 500 investors are still down -30% from November 30, 2007, through October 30, 2009.

This long-term trend indicator has repeatedly done an exceptional job of filtering out all the noise and keeping us on the right side of the market.