
Friday, July 31, 2015


Wednesday, July 29, 2015
Soaring College Textbook Prices: Part of the Unsustainable Higher Education Bubble

The graph above shows the historical increase in college textbooks (+981%) between 1978 and 2014 in comparison to increases in the overall CPI (+262%), the CPI for medical care (+604%), and the median sales price for new homes (+408%) over that 37-year period.
Textbook prices seem like they are clearly on an unsustainable trajectory.
Monday, July 27, 2015
Vantage Point UPDATE: Intermediate-Term and Long-Term Trend Analysis
On Friday, July 24, the S&P 500 closed @ 2080, and that was...
+2.2% ABOVE its 12-Month moving average which stood @ 2035.
+0.3% ABOVE its 40-Week moving average which stood @ 2074.
-0.9% BELOW its 10-Week moving average which stood @ 2099.
Therefore, the INTERMEDIATE-Term trend is NEUTRAL
and the LONG-Term trend is UP.
Friday, July 24, 2015
Global Growth is In Sync for the 1st Time in 5 Years!

Jeffrey Kleintop at Charles Schwab pointed out that based on GDP projections, 2015 is setting up to be the first time that the three biggest developed economies have all grown in a year since 2010.
While the US has steadily increased GDP since then, Japan and the Eurozone have traded off recessions in during the four years. Japan contracted in 2011 and 2014, while the Eurozone contracted in 2012 and 2013.
"While the U.S. Fed is withdrawing economic stimulus, the central banks of Europe and Japan are aggressively adding stimulus," Kleintop wrote. "This should help to sustain the economic recovery and support the stock market over the coming year."
Read more @:
Global Growth is In Sync for the 1st Time in 5 Years
Wednesday, July 22, 2015
Obamacare Premiums Soar for the 95% of American Who Don't Qualify for Subsidies

For most people, insurance premiums went up as a result of the Affordable Care Act.
If we look at premiums for the 95% of Americans who don't qualify for subsidies, men aged 30, on average, are paying +73% more than they did before the ACA went into effect.
And women aged 63 are paying +38% more.
Young men are seeing the greatest increase, with those aged 23 now paying +78% more.
Young men are seeing the greatest increase, with those aged 23 now paying +78% more.
And monthly premiums for family policies rose +93.7%, from $378 for 2013 plans to $732 for 2014 plans.
The biggest factors leading to the increase are the fact that insurance must now cover new applicants even if they have preexisting illnesses, and the mandatory inclusion of several previously optional coverage items.
Monday, July 20, 2015
Vantage Point UPDATE: Intermediate-Term and Long-Term Trend Analysis
On Friday, July 17, the S&P 500 closed @ 2127, and that was...
+4.1% ABOVE its 12-Month moving average which stood @ 2042.
+2.8% ABOVE its 40-Week moving average which stood @ 2069.
+1.1% ABOVE its 10-Week moving average which stood @ 2103.
Therefore, the INTERMEDIATE-Term trend is NEUTRAL
and the LONG-Term trend is UP.
Friday, July 17, 2015

Wednesday, July 15, 2015
6 Key Life Events Americans Are Delaying
Due to financial concerns, Americans are now being forced to put off major life events like going to college, getting married, buying a home and having kids.
According to a survey by the American Institute of CPAs, the amount of Americans who are delaying life events has more than doubled since 2007. Among the largest reasons, 60% surveyed cited their lack of savings played a role in their decision.
Below are six of the key life events Americans are delaying...

- See more at:
6 Key Life Events Americans Are Delaying
Monday, July 13, 2015
Vantage Point UPDATE: Intermediate-Term and Long-Term Trend Analysis
On Friday, July 10, the S&P 500 closed @ 2077, and that was...
+2.1% ABOVE its 12-Month moving average which stood @ 2034.
+0.6% ABOVE its 40-Week moving average which stood @ 2064.
-1.2% BELOW its 10-Week moving average which stood @ 2102.
Therefore, the INTERMEDIATE-Term trend is NEUTRAL
and the LONG-Term trend is UP.
Friday, July 10, 2015
Wednesday, July 8, 2015

Monday, July 6, 2015
Vantage Point UPDATE: Intermediate-Term and Long-Term Trend Analysis
On Friday, July 3, the S&P 500 closed @ 2077, and that was...
+2.1% ABOVE its 12-Month moving average which stood @ 2034.
+0.8% ABOVE its 40-Week moving average which stood @ 2061.
-1.4% BELOW its 10-Week moving average which stood @ 2106.
Therefore, the INTERMEDIATE-Term trend is NEUTRAL
and the LONG-Term trend is UP.
Wednesday, July 1, 2015
Why Keeping Energy Costs Low Benefits the Poor the Greatest...

The chart above shows the share of after-tax income spent on energy by income quintiles in 2013.
For example, households in the lowest income quintile in the US spent an average of $971 in 2013 on electricity ($81 per month), $1,231 on gas and motor oil ($102.50 per month) and $217 on natural gas, for total energy spending of $2,419.
Based on average disposable income of $10,092 in 2013, the poorest 20% of American households spend 24% of their after-tax income on energy.
As the chart shows, the middle income quintile spent 10% of their disposable income on energy, while the richest 20% spent only 5% of their income on energy.
Monday, June 29, 2015
Vantage Point UPDATE: Intermediate-Term and Long-Term Trend Analysis
On Friday, June 26, the S&P 500 closed @ 2101, and that was...
+3.4% ABOVE its 12-Month moving average which stood @ 2032.
+2.1% ABOVE its 40-Week moving average which stood @ 2059.
-0.4% BELOW its 10-Week moving average which stood @ 2110.
Therefore, the INTERMEDIATE-Term trend is NEUTRAL
and the LONG-Term trend is UP.
Friday, June 26, 2015
Wednesday, June 24, 2015
Monday, June 22, 2015
Vantage Point UPDATE: Intermediate-Term and Long-Term Trend Analysis
On Friday, June 19, the S&P 500 closed @ 2110, and that was...
+3.7% ABOVE its 12-Month moving average which stood @ 2034.
+2.6% ABOVE its 40-Week moving average which stood @ 2056.
+0.1% ABOVE its 10-Week moving average which stood @ 2108.
Therefore, the INTERMEDIATE-Term trend is NEUTRAL
and the LONG-Term trend is UP.
Friday, June 19, 2015
Annuities: Understanding the Difference Between Fixed And Variable Annuities
Do you know how much the fees and expenses associated with your retirement investments are?

Annuities offer tax sheltered growth which can result in significant long-term returns for you if you contribute to the annuity for a long period and wait to withdraw funds until retirement. You get peace of mind from a guaranteed income stream, and the tax benefits of deferred annuities can amount to substantial savings.
There are Two Categories of Annuities – Fixed and Variable

Annuities offer tax sheltered growth which can result in significant long-term returns for you if you contribute to the annuity for a long period and wait to withdraw funds until retirement. You get peace of mind from a guaranteed income stream, and the tax benefits of deferred annuities can amount to substantial savings.
There are Two Categories of Annuities – Fixed and Variable
A Fixed Rate Annuity is sold by an Insurance
Company and offers you a very low-risk retirement account. The owner is
guaranteed at least a minimum rate of investment return. The insurer declares a
specific credited rate of return based on the investment performance of its general
account assets. You can receive a fixed amount of money every month for the
rest of your life. However, the price for removing risk is missing out on
growth opportunity. Should the financial markets enjoy bull market conditions
during your retirement, you forgo additional gains on your annuity funds.
A Variable Annuity is sold by a stockbroker and
is classified as a Security Investment by the SEC. A variable annuity is
subject to stock market risk. With a variable annuity, contract owners are able
to choose from a wide range of investment options called subaccounts, each of
which generally invests in shares of a single underlying mutual fund. As with
mutual funds, the investment return of variable annuities fluctuates. The most
common objection to variable annuities is how notoriously expensive they can
be.


A Variable Annuity with $100,000 in account value would pay $3,750 per year in fees before any interest is credited.
Fixed Annuities Offer Less Investment Risk. Generally,
fixed annuities involve less investment risk than variable annuities because
they offer a guaranteed minimum rate of interest. The minimum rate is not
affected by fluctuations in market interest rates or the company’s yearly
profits. Most people like the security of knowing that their annuity payments
will never vary or that they will receive at least a minimum amount of credited
interest.
Here are a few Guidelines to Consider When Making a
Change to Your Retirement Portfolio:
Buy From Someone Reputable. Whether you are
working through an adviser or directly through a distributor, get the facts on
the firm’s financial strength and business practices. What is the company’s
rating with third-party ratings agencies? Is it known for fair claims-paying
practices? How reliable is its customer service? Dealing with a company that is
fair and financially sound may help save you from financial headaches in the
long run.
Educate yourself. Knowledge is Power. Make sure
to ask your financial adviser about any potential costs that might not be
apparent. The point here is to completely understand what you are paying for
and how to utilize the benefits when you need them.
Be sure to consider annuities as part of your overall
investment strategy, as they can add value and security to your retirement.
Watch the video below for more information on the fees
and expenses associated with Variable Annuities...
Wednesday, June 17, 2015
Case Study: Managing Taxation on Retirement Income Withdrawals
Case Study: Managing Taxation on Retirement Income Withdrawals
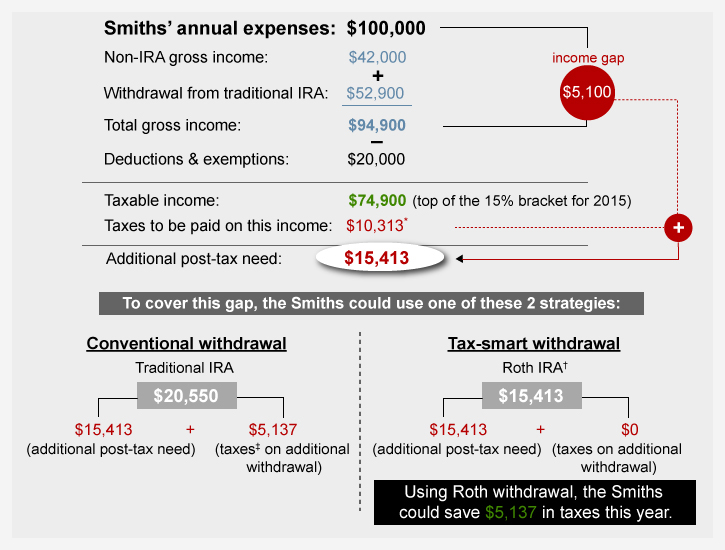
As a way to help minimize the income taxes one pays, consider the following hypothetical scenario.
It illustrates the way a retired married couple whose annual expenses total $100,000 might seek to manage their taxes.
Our hypothetical couple expects $42,000 in gross income (all taxable) before tapping their retirement accounts, so their gross income gap—(before considering taxes)—is $58,000. They anticipate $20,000 in deductions and exemptions, so their expected taxable income before withdrawals is $22,000. If they withdraw $52,900 from their traditional IRAs, it would bring their taxable income to $74,900—the top of the 15% bracket for 2015.
They could then withdraw the remaining $5,100 that they need to cover their income gap from a Roth IRA, which does not generate taxable income (assuming the withdrawal is qualified). The chart below shows their cash flow and taxable income:
Example: How to Manage Taxes on Withdrawals for Retirement Accounts
This hypothetical example is for illustrative purposes only. This hypothetical scenario assumed the couple does not receive Social Security benefits. Social Security income would further complicate the tax scenario described above and should be considered when creating a withdrawal strategy.
Other Options for Our Hypothetical Couple
The hypothetical couple in this scenario leaves the bulk of Roth IRA assets alone, leaving them in place to potentially generate tax-free growth. In certain situations, however, it may be advantageous to tap Roth assets instead of tax-deferred or taxable accounts. These include situations when:
- Any distributions at all from a tax-deferred account would cause your taxable income to exceed your target marginal tax rate
- Withdrawing from a taxable account would require selling assets held less than a year, resulting in short-term capital gains, which are taxed at ordinary income tax rates
- You are also trying to minimize taxes on Social Security benefits, and withdrawals from a tax-deferred account would have an impact on the taxability of those benefits
Your circumstances may be considerably different from those described in the scenario. Nevertheless, you may be able to apply the principles to your own situation. A tax professional can help you explore the implications of different withdrawal strategies, help minimize the amount of taxes you pay on hard-earned savings, and, of course, help you maximize your ability to live the retirement you envision.
Monday, June 15, 2015
Vantage Point UPDATE: Intermediate-Term and Long-Term Trend Analysis
On Friday, June 12, the S&P 500 closed @ 2094, and that was...
+3.1% ABOVE its 12-Month moving average which stood @ 2031.
+2.0% ABOVE its 40-Week moving average which stood @ 2053.
-0.6% BELOW its 10-Week moving average which stood @ 2107.
Therefore, the INTERMEDIATE-Term trend is NEUTRAL
and the LONG-Term trend is UP.
Friday, June 12, 2015
Wednesday, June 10, 2015
Bull Market Reaches 6 Years and 3 Months...
The ongoing bull market for the S&P 500 reached 75 months in length, or 6 years and 3 months, as of the close of trading on June 09, 2015.
This bull run, the index’s 11th since 1950, is the 3rd bull in the last 65 years to reach 75 months in length.
Monday, June 8, 2015
Vantage Point UPDATE: Intermediate-Term and Long-Term Trend Analysis
On Friday, June 5, the S&P 500 closed @ 2094, and that was...
+3.1% ABOVE its 12-Month moving average which stood @ 2030.
+2.1% ABOVE its 40-Week moving average which stood @ 2051.
-0.5% BELOW its 10-Week moving average which stood @ 2104.
Therefore, the INTERMEDIATE-Term trend is NEUTRAL
and the LONG-Term trend is UP.
Friday, June 5, 2015
Why LA's $15 Minimum Wage Will Really Be $19.28

Read More At Investor's Business Daily:
Why LA's $15 Minimum Wage Will Really Be $19.28
Follow us: @IBDinvestors on Twitter | InvestorsBusinessDaily on Facebook
Wednesday, June 3, 2015
GDP Declines -0.7% in 1Q 2015

Read More @ Investor's Business Daily:
As Obama's Economy Falls, White House Excuses Boom
Follow us: @IBDinvestors on Twitter | InvestorsBusinessDaily on Facebook
Subscribe to:
Posts (Atom)
