Showing posts with label taxation. Show all posts
Showing posts with label taxation. Show all posts
Wednesday, June 21, 2017
The Top 0.1% Pay 23.5% of all Federal Income Taxes
TWO OUT OF THREE - 64% of all individual tax returns filed in 2012 (92.9 million returns out of 144.9 million returns filed) reported less than $50,000 of adjusted gross income.
(source: Internal Revenue Service).
THE REALLY RICH - The Top 0.1% of U.S. taxpayers (the Top 1 out of every 1,000 taxpayers) is estimated to pay 23.5% of all Federal income tax for the 2014 tax year
(source: Tax Policy Center).
Who's not paying their fair share?


Wednesday, May 3, 2017
Friday, February 10, 2017
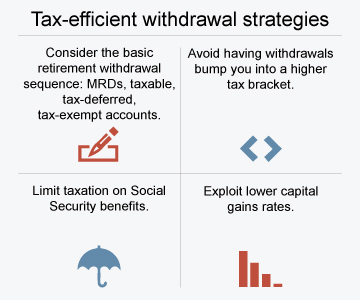
Case Study: Managing Taxation on Retirement Income Withdrawals
Example: How to Manage Taxes on Withdrawals for Retirement Accounts.
This hypothetical example is for illustrative purposes only. This hypothetical scenario assumed the couple does not receive Social Security benefits. Social Security income would further complicate the tax scenario described above and should be considered when creating a withdrawal strategy.
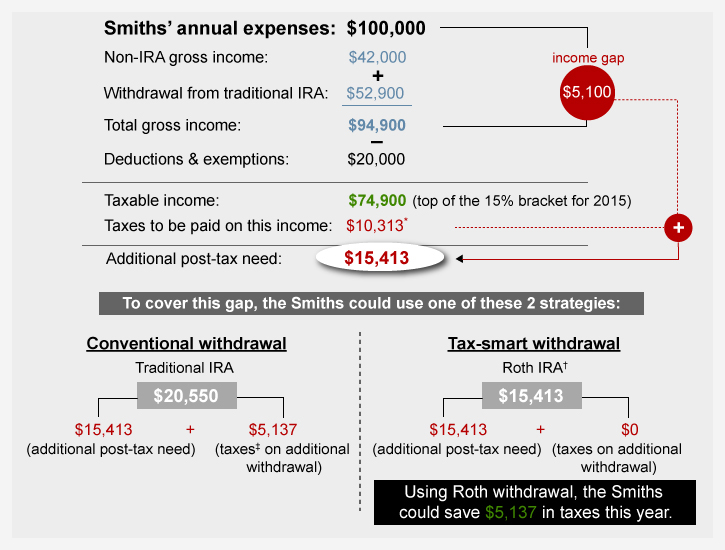
As a way to help minimize the taxes you’ll pay, consider the following hypothetical scenario. It illustrates the way a retired married couple whose annual expenses total $100,000 might seek to manage their taxes.
Our hypothetical couple expects $42,000 in gross income (all taxable) before tapping their retirement accounts, so their gross income gap—(before considering taxes)—is $58,000. They anticipate $20,000 in deductions and exemptions, so their expected taxable income before withdrawals is $22,000. If they withdraw $52,900 from their traditional IRAs, it would bring their taxable income to $74,900—the top of the 15% bracket. They could then withdraw the remaining $5,100 that they need to cover their income gap from a Roth IRA, which does not generate taxable income (assuming the withdrawal is qualified). The chart (above) shows their cash flow and taxable income.
Our hypothetical couple expects $42,000 in gross income (all taxable) before tapping their retirement accounts, so their gross income gap—(before considering taxes)—is $58,000. They anticipate $20,000 in deductions and exemptions, so their expected taxable income before withdrawals is $22,000. If they withdraw $52,900 from their traditional IRAs, it would bring their taxable income to $74,900—the top of the 15% bracket. They could then withdraw the remaining $5,100 that they need to cover their income gap from a Roth IRA, which does not generate taxable income (assuming the withdrawal is qualified). The chart (above) shows their cash flow and taxable income.
Other Options for Our Hypothetical Couple
The hypothetical couple in this scenario leaves the bulk of Roth IRA assets alone, leaving them in place to potentially generate tax-free growth. In certain situations, however, it may be advantageous to tap Roth assets instead of tax-deferred or taxable accounts. These include situations when:
- Any distributions at all from a tax-deferred account would cause your taxable income to exceed your target marginal tax rate
- Withdrawing from a taxable account would require selling assets held less than a year, resulting in short-term capital gains, which are taxed at ordinary income tax rates
- You are also trying to minimize taxes on Social Security benefits, withdrawals from a tax-deferred account would have an impact on the taxability of those benefits
Your circumstances may be considerably different from those described in the scenario. Nevertheless, you may be able to apply the principles to your own situation. A tax professional can help you explore the implications of different withdrawal strategies, help minimize the amount of taxes you pay on hard-earned savings, and, of course, help you maximize your ability to live the retirement you envision.
Friday, February 3, 2017
Friday, January 27, 2017
Tips for Deducting More at Tax Time
Tax Deductions come in two basic types:
“Above-the-Line” and “Below-the-Line.”
The “Line” is your Adjusted Gross Income, or AGI.
Above-the-Line deductions are subtracted from your total income, thus lowering your AGI.
Another advantage is that many “Above-the-Line” deductions are allowed under the Alternative Minimum Tax, or AMT.
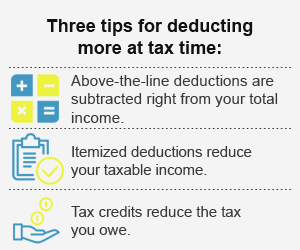
A lower AGI can potentially increase the value of your Below-the-Line itemized deductions, which often come with limits.
For example, you can deduct your medical and dental expenses, but only the amount that exceeds 10% of your AGI (7.5% if you or your spouse is 65 or older) and only if you itemize deductions on your federal tax return.
So the lower your AGI, the quicker you hit 10% and can start deducting.
You can’t claim these expenses if you take the standard deduction which, for 2016, is $6,300 for taxpayers who are single or married filing separately, $12,600 for married filing jointly, and $9,300 for heads of household (single taxpayers with dependents).
Wednesday, December 28, 2016
Friday, November 4, 2016
Friday, October 21, 2016
Wednesday, August 24, 2016
Friday, June 10, 2016
Thursday, June 2, 2016
Friday, April 1, 2016
Wednesday, February 10, 2016
Wednesday, January 13, 2016
.jpg)
Friday, November 27, 2015
Learn Liberty VIDEO of the Week: "Don't Higher Tax Rates Always Result in Higher Tax Revenues?"
Do higher tax rates result in higher tax revenues? Not always. #LearnLibertyClassic
Posted by Learn Liberty on Monday, November 23, 2015
Wednesday, September 9, 2015
Wednesday, September 2, 2015
Why The Bottom 80% of Taxpayers AREN'T Paying Their Fair Share...

The figures displayed in the graph above show the amount of federal taxes paid by the average household in each income quintile minus the average amount of government transfers received by those households in 2011.
For each of the three lower income quintiles, their average government transfer payments exceeded their federal taxes paid by $8,600, $12,500, and $9,100 respectively, and therefore the entire bottom 60% of US households are “net recipients” of government transfer payments.
Averaged across all three lower income quintiles, we could say that the lowest 60% of American households by income received an average transfer payment of about $10,000 in 2011.
And because the government has no money of its own, where did those transfer payments come from to finance the “net recipient” households? Where else, but from the top two income quintiles, and realistically almost exclusively from Americans in the highest quintile.
And because the government has no money of its own, where did those transfer payments come from to finance the “net recipient” households? Where else, but from the top two income quintiles, and realistically almost exclusively from Americans in the highest quintile.
Specifically, the average household in the fourth quintile paid slightly more in federal taxes ($14,800) than it received in transfer payments ($14,100) in 2011, making the average household in the second-highest income quintile a “net payer” household in the amount of $700 in 2011.
Basically, households in the fourth income quintile paid enough in taxes to cover their transfer payments, and then made a minor contribution of $700 on average to help cover the transfer payments of the “net recipient” households in the bottom 60% and make a small contribution to the federal government’s other expenditures.
But the major finding of the CBO report is that the households in the top income quintile are the real “net payers” of the US economy.
The average household in the top one-fifth of American households by income paid $57,500 in federal taxes in 2011, received $11,000 in government transfers, and therefore made a net positive contribution of $46,500.
The 2nd-highest income quintile basically just barely covers its transfer payments, so it’s really the top 20% of “net payer” households that are financing transfer payments to the entire bottom 60% AND financing the non-financed operations of the entire federal government.
The 2nd-highest income quintile basically just barely covers its transfer payments, so it’s really the top 20% of “net payer” households that are financing transfer payments to the entire bottom 60% AND financing the non-financed operations of the entire federal government.
Here’s another way to think about the burden of the “net payer” top income quintile. The average household in that income quintile made a contribution net of transfers in 2011 in the amount of $46,500.
That would be equivalent to the average household in the top 20% (quintile) writing four checks:
1) one check in the amount of $8,600 that would cover the average net transfer payments of a household in the bottom quintile,
2) another check for $12,500 to cover the average net transfers of a household in the second lowest quintile,
3) a third check in the amount of $9,100 to cover the average net transfer payments to a household in the middle income quintile, and
4) then finally writing a check for the balance of $16,300 that would go directly to the federal government, which for the households in the quintile as a whole would have covered almost 100% of the non-financed federal government spending in 2011.
So except for a small contribution net of transfers in the amount of $700 from the average household in the fourth quintile, the highest income quintile is basically financing the entire system of transfer payments to the bottom 60% AND the entire operation of the federal government.
And yet don’t we hear all the time that “The Rich” AREN’T paying their fair share of taxes and that they need to shoulder a greater share of the federal tax burden?
Hey, the Top 20% are already shouldering almost the entire federal tax burden along with almost the entire system of entitlements and transfer payments!
Hey, the Top 20% are already shouldering almost the entire federal tax burden along with almost the entire system of entitlements and transfer payments!
BUT that’s not “Fair” enough already?
Isn't abundantly evident that the bottom 80% aren't paying anywhere near their "Fair Share?"
Wednesday, June 24, 2015
Friday, April 24, 2015
Obama Corporate Tax Reform Would Cut 35% Rate To Only 34%

The statutory U.S. tax rate is the highest in the world.
The federal rate of 35% plus state taxes put the U.S. rate at 39.1% vs. a 25.1% average for other OECD countries, the Congressional Research Service says.
Unfortunately, that puts U.S. companies at a competitive disadvantage in the global market place.
Friday, September 5, 2014
The Top 10 Retirement Challenges: #5. Withdrawal Strategy
 Often it's very difficult to move from a lifetime of spending what comes in to drawing down on a portfolio. Coming up with an amount to keep in cash reserve -- and maintaining it -- is critical.
 Many people might find 3 bucket strategy helps them compartmentalize what they are spending in order to avoid stress over market fluctuations.
Managing the tax impact of withdrawals and understanding how each piece of income is taxed is essential.
Subscribe to:
Posts (Atom)
