Monday, November 9, 2015
Vantage Point UPDATE: Intermediate-Term and Long-Term Trend Analysis
On Friday, November 6, the S&P 500 closed @ 2099, and that was...
+3.2% ABOVE its 12-Month moving average which stood @ 2034.
+1.6% ABOVE its 40-Week moving average which stood @ 2066.
+4.9% ABOVE its 10-Week moving average which stood @ 2002.
Therefore, the INTERMEDIATE-Term trend is NEUTRAL
and the LONG-Term trend is FLAT.


Friday, November 6, 2015
VIDEO of the Week: "John D. Rockefeller - America's First Billionaire"
New Video! "Rockefeller: The Richest American Who Ever Lived"Was America's first billionaire, John D. Rockefeller, a...
Posted by PragerU on Monday, October 5, 2015
Wednesday, November 4, 2015
 F
F
Monday, November 2, 2015
Vantage Point UPDATE: Intermediate-Term and Long-Term Trend Analysis
On Friday, October 30, the S&P 500 closed @ 2079, and that was...
+2.8% ABOVE its 12-Month moving average which stood @ 2022.
+0.8% ABOVE its 40-Week moving average which stood @ 2063.
+4.4% ABOVE its 10-Week moving average which stood @ 1991.
Therefore, the INTERMEDIATE-Term trend is Moderately Bullish
and the LONG-Term trend is FLAT.
Friday, October 30, 2015
Learn Liberty VIDEO of the Week: "What are the differences between being pro-business and being for free markets?"
What are the differences between being pro-business and being for free markets?Professor Horwitz suggests that...
Posted by Learn Liberty on Saturday, September 12, 2015
Wednesday, October 28, 2015

Monday, October 26, 2015
Vantage Point UPDATE: Intermediate-Term and Long-Term Trend Analysis
On Friday, October 23, the S&P 500 closed @ 2065, and that was...
+2.2% ABOVE its 12-Month moving average which stood @ 2021.
-0.1% BELOW its 40-Week moving average which stood @ 2063.
+3.7% ABOVE its 10-Week moving average which stood @ 1991.
Therefore, the INTERMEDIATE-Term trend is NEUTRAL
and the LONG-Term trend is FLAT.
Friday, October 23, 2015
Learn Liberty VIDEO of the Week: "Are Profits and Capitalism Dirty Words?"
Are profits and capitalism dirty words? Would the world be better off without them? Or are profits progressive -- the...
Posted by PragerU on Thursday, October 15, 2015
Wednesday, October 21, 2015
Health Premiums Have Climbed +$4,865 Since Obama Promised to Cut Them -$2,500

That's a negative -$7,365 per family, per year off the mark of the President's promise.
Read More At Investor's Business Daily:
Health Premiums Have Climbed $4,865 Since Obama Promised to Cut Them $2,500
Monday, October 19, 2015
Vantage Point UPDATE: Intermediate-Term and Long-Term Trend Analysis
On Friday, October 16, the S&P 500 closed @ 2033, and that was...
+0.9% ABOVE its 12-Month moving average which stood @ 2015.
-1.4% BELOW its 40-Week moving average which stood @ 2061.
+2.6% ABOVE its 10-Week moving average which stood @ 1982.
Therefore, the INTERMEDIATE-Term trend is NEUTRAL
and the LONG-Term trend is FLAT.
Friday, October 16, 2015
Learn Liberty VIDEO of the Week: "Should there be limits on what we can and can’t buy?"
Should there be limits on what we can and can’t buy?In today's #LearnLibertyClassic, Professor Jaworski asks students...
Posted by Learn Liberty on Tuesday, September 15, 2015
Monday, October 12, 2015
Vantage Point UPDATE: Intermediate-Term and Long-Term Trend Analysis
On Friday, October 9, the S&P 500 closed @ 2015, and that was...
+0.1% ABOVE its 12-Month moving average which stood @ 2012.
-2.2% BELOW its 40-Week moving average which stood @ 2061.
+1.4% ABOVE its 10-Week moving average which stood @ 1987.
Therefore, the INTERMEDIATE-Term trend is NEUTRAL
and the LONG-Term trend is NEUTRAL.
Friday, October 9, 2015
Learn Liberty VIDEO of the Week: "Is Price Gouging Immoral or Essential?..."
If the power goes out during a natural disaster, who should be able to get an emergency generator?Many people would...
Posted by Learn Liberty on Thursday, October 1, 2015
Wednesday, October 7, 2015
The Threat of Global Deflation...
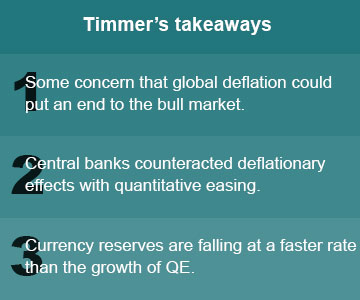
If the recent decline in global currency reserves is an adequate proxy for the forces of global deflation, then we are now possibly facing the most serious threat to the global bull market since it began in 2009. Central banks have a huge QE hurdle to overcome (more than $1 trillion).
I believe they will overcome it, thanks in part to the ECB and BoJ. But with the Fed missing in action from the QE battle (at least for now), let’s hope China doesn’t devalue its currency even more than it did in August, because that could drive emerging markets into a prolonged period of deflationary QT.
But then again, this is a dynamic game, so while a Fed lift-off and the lack of QE seem like a sure thing for now, that could change depending upon the gyrations of the global economy.
Monday, October 5, 2015
Vantage Point UPDATE: Intermediate-Term and Long-Term Trend Analysis
On Friday, October 2, the S&P 500 closed @ 1951, and that was...
-2.5% BELOW its 12-Month moving average which stood @ 2002.
-5.4% BELOW its 40-Week moving average which stood @ 2062.
-2.2% BELOW its 10-Week moving average which stood @ 1996.
Therefore, the INTERMEDIATE-Term trend is BEARISH
and the LONG-Term trend is SIDEWAYs.
Friday, October 2, 2015
Lean Liberty VIDEO of the Week: "Do free market advocates have a sound defense for rejecting government regulations?"
Do free market advocates have a sound defense for rejecting government regulations? In this #LearnLibertyClassic,...
Posted by Learn Liberty on Sunday, September 13, 2015
Wednesday, September 30, 2015
Why The Affordable Care Act is Largely Unaffordable...

The ObamaCare mandate's primary impact will be to compel low-income households to buy bronze coverage with deductibles of up to $6,850 per adult that are well beyond their capacity to afford.
Because any semi-serious health issue will torpedo their finances long before ObamaCare begins to pay the bills, this situation raises a question of whether it is ethical to threaten them with a mandate penalty.
In addition, after two years of ObamaCare enrollment, it now appears likely that this contradiction — the Affordable Care Act mandating unaffordable care — will be the rule, not the exception, for modest-income households between 150% and 250% of the poverty level.
Read More At Investor's Business Daily:
The ObamaCare Individual Mandate's Harsh Reality
Monday, September 28, 2015
Vantage Point UPDATE: Intermediate-Term and Long-Term Trend Analysis
On Friday, September 25, the S&P 500 closed @ 1931, and that was...
-4.1% BELOW its 12-Month moving average which stood @ 2013.
-6.5% BELOW its 40-Week moving average which stood @ 2066.
-3.8% BELOW its 10-Week moving average which stood @ 2008.
Therefore, the INTERMEDIATE-Term trend is BEARISH
and the LONG-Term trend is BEARISH.
Wednesday, September 23, 2015
10 Early Warning Signs & Symptoms of Alzheimer's Disease

Typical Age-Related Memory Loss vs. Alzheimer's
The Alzheimer’s Association says it’s normal for people to occasionally have memory lapses as they age. For example, a healthy person may forget the name of someone he or she just met, while people with dementia may forget the name of a longtime friend. The following table, taken from the Alzheimer’s Association website, contrasts typical age-related memory loss with signs of Alzheimer’s:

See more at:
10 Early Signs & Symptoms: Alzheimers
Monday, September 21, 2015
Vantage Point UPDATE: Intermediate-Term and Long-Term Trend Analysis
On Friday, September 18, the S&P 500 closed @ 1958, and that was...
-2.9% BELOW its 12-Month moving average which stood @ 2017.
-5.4% BELOW its 40-Week moving average which stood @ 2069.
-3.4% BELOW its 10-Week moving average which stood @ 2028.
Therefore, the INTERMEDIATE-Term trend is BEARISH
and the LONG-Term trend is Rolling Over.
Friday, September 18, 2015
Wednesday, September 16, 2015
S&P 500 Monthly SELL Signal - 5th Sell Signal in 18 Years

The chart of the S&P 500's 17-month moving average triggered the 1st SELL signal since 2011, on August 31, 2015 the S&P 500's August 2015 monthly close was below the SELL line.
In the past 18 years it has issued SELLs 5 times, of which 2 were reversed back to BUYs (1998 and 2011), but two (2001 and 2007) signaled the beginning of major bear markets.
Monday, September 14, 2015
Vantage Point UPDATE: Intermediate-Term and Long-Term Trend Analysis
On Friday, September 11, the S&P 500 closed @ 1961, and that was...
-2.8% BELOW its 12-Month moving average which stood @ 2018.
-5.3% BELOW its 40-Week moving average which stood @ 2070.
-3.9% BELOW its 10-Week moving average which stood @ 2040.
Therefore, the INTERMEDIATE-Term trend is NEGATIVE
and the LONG-Term trend is SIDEWAYs.
Friday, September 11, 2015
America's Net Oil Imports Continue Falling Sharply...

U.S. net petroleum imports fell to 26.2% this year through May, which was the lowest dependence on foreign sources of petroleum since 1971 when the country’s net imports were 24.3%.
Wednesday, September 9, 2015
Monday, September 7, 2015
Vantage Point UPDATE: Intermediate-Term and Long-Term Trend Analysis
On Friday, September 4, the S&P 500 closed @ 1921, and that was...
-4.5% BELOW its 12-Month moving average which stood @ 2012.
-7.3% BELOW its 40-Week moving average which stood @ 2073.
-6.3% BELOW its 10-Week moving average which stood @ 2051.
Therefore, the INTERMEDIATE-Term trend is BEARISH
and the LONG-Term trend is NEGATIVE.
Friday, September 4, 2015
Learn Liberty VIDEO of the Day: The EPA. Doing More Harm Than Good?
What are some examples you've seen where the EPA has done more harm to the environment than good?Professor Roger...
Posted by Learn Liberty on Tuesday, August 18, 2015
Wednesday, September 2, 2015
Why The Bottom 80% of Taxpayers AREN'T Paying Their Fair Share...

The figures displayed in the graph above show the amount of federal taxes paid by the average household in each income quintile minus the average amount of government transfers received by those households in 2011.
For each of the three lower income quintiles, their average government transfer payments exceeded their federal taxes paid by $8,600, $12,500, and $9,100 respectively, and therefore the entire bottom 60% of US households are “net recipients” of government transfer payments.
Averaged across all three lower income quintiles, we could say that the lowest 60% of American households by income received an average transfer payment of about $10,000 in 2011.
And because the government has no money of its own, where did those transfer payments come from to finance the “net recipient” households? Where else, but from the top two income quintiles, and realistically almost exclusively from Americans in the highest quintile.
And because the government has no money of its own, where did those transfer payments come from to finance the “net recipient” households? Where else, but from the top two income quintiles, and realistically almost exclusively from Americans in the highest quintile.
Specifically, the average household in the fourth quintile paid slightly more in federal taxes ($14,800) than it received in transfer payments ($14,100) in 2011, making the average household in the second-highest income quintile a “net payer” household in the amount of $700 in 2011.
Basically, households in the fourth income quintile paid enough in taxes to cover their transfer payments, and then made a minor contribution of $700 on average to help cover the transfer payments of the “net recipient” households in the bottom 60% and make a small contribution to the federal government’s other expenditures.
But the major finding of the CBO report is that the households in the top income quintile are the real “net payers” of the US economy.
The average household in the top one-fifth of American households by income paid $57,500 in federal taxes in 2011, received $11,000 in government transfers, and therefore made a net positive contribution of $46,500.
The 2nd-highest income quintile basically just barely covers its transfer payments, so it’s really the top 20% of “net payer” households that are financing transfer payments to the entire bottom 60% AND financing the non-financed operations of the entire federal government.
The 2nd-highest income quintile basically just barely covers its transfer payments, so it’s really the top 20% of “net payer” households that are financing transfer payments to the entire bottom 60% AND financing the non-financed operations of the entire federal government.
Here’s another way to think about the burden of the “net payer” top income quintile. The average household in that income quintile made a contribution net of transfers in 2011 in the amount of $46,500.
That would be equivalent to the average household in the top 20% (quintile) writing four checks:
1) one check in the amount of $8,600 that would cover the average net transfer payments of a household in the bottom quintile,
2) another check for $12,500 to cover the average net transfers of a household in the second lowest quintile,
3) a third check in the amount of $9,100 to cover the average net transfer payments to a household in the middle income quintile, and
4) then finally writing a check for the balance of $16,300 that would go directly to the federal government, which for the households in the quintile as a whole would have covered almost 100% of the non-financed federal government spending in 2011.
So except for a small contribution net of transfers in the amount of $700 from the average household in the fourth quintile, the highest income quintile is basically financing the entire system of transfer payments to the bottom 60% AND the entire operation of the federal government.
And yet don’t we hear all the time that “The Rich” AREN’T paying their fair share of taxes and that they need to shoulder a greater share of the federal tax burden?
Hey, the Top 20% are already shouldering almost the entire federal tax burden along with almost the entire system of entitlements and transfer payments!
Hey, the Top 20% are already shouldering almost the entire federal tax burden along with almost the entire system of entitlements and transfer payments!
BUT that’s not “Fair” enough already?
Isn't abundantly evident that the bottom 80% aren't paying anywhere near their "Fair Share?"
Subscribe to:
Posts (Atom)
