Saturday, January 30, 2010

Status of Our Vantage Point Investment Models


NONE of our Vantage Point Models have changed since the last update.


As of the close on Friday, January 29th, the status of our Vantage Point Models is as follows:


Our Intermediate-Term Stock Model is NEGATIVE as of May 16, 2008.
Our SmallCap Momentum Model is NEGATIVE as of January 4, 2008.

Our Treasury Bond Model is NEGATIVE as of February 20, 2009.
Our High-Yield Bond Model is POSITIVE as of July 24, 2009.

In our relative strength work, we favor:
  • SmallCap funds over LargeCap funds         (since 12/18/09)
  • Growth funds over Value funds                 (since 01/08/10)
  • U.S. funds over Foreign funds                   (since 11/20/09)
  • SmallCap Value over LargeCap Growth     (since 12/18/09)

Thursday, January 28, 2010

Country P/E Ratios and GDP Growth

Many investors use the PEG Ratio as a valuation tool these days because it puts a company's growth prospects into perspective along with the widely followed price to earnings ratio. The PEG ratio is the P/E Ratio over the Growth Rate, and a PEG of less than one is generally considered good.

In this regard, Bespoke created "PEG" ratios for a number of countries using the P/E ratio of each country's main equity market index along with 2010 estimated GDP growth rates. Just as with stocks, the lower the country PEG, the more attractive.

As shown, India has the best PEG out of the countries we analyzed. It has a P/E ratio of 26.19 and estimated 2010 GDP growth of 8%. While its P/E isn't as low as a lot of countries, its growth rate is very high. China ranks 2nd with a PEG of 3.66.

The U.S. ranks in the middle of the pack with a P/E of 24.53 and estimated GDP growth of 2.6%.

At the bottom of the list sits Switzerland, Italy, and the UK, while Australia, Japan, and Spain have negative PEGs due to either a negative P/E Ratio or negative estimated GDP growth.


Chart and analysis courtesy of Bespoke Investment Group

Wednesday, January 27, 2010

The New Retirement Challenge

"Seniors must redefine their idea of retirement to be successful."

New statistics for 2009 show most Americans believe they will not be able to afford retirement anytime soon. The annual
Retirement Confidence Survey, conducted by Matthew Greenwald & Associates, found that only 13% of respondents feel very confident that they will enjoy a comfortable retirement, the smallest percentage since the survey began in 1993.


Respondents expect to work longer due to the economic downturn, with 28% of workers reporting that in 2009 they pushed back their expected retirement date.

Furthermore, 89% of those who are delaying retirement indicated they would do so for financial reasons.


According to Robert J. Krakower, CFP and author of Redefining Retirement for a New Generation, the old model of retirement no longer applies.


Krakower believes that would-be retirees must adopt new views of retirement planning if they hope to retire on time. Forces such as increased life expectancy, the sheer size of the baby boom generation and the massive replacement of pensions with 401(k) plans, shift the risk away from the corporations, where it used to be, and onto the shoulders of individuals,” he said.

The current generation facing retirement, the baby boomers, face risks that previous generations did not, namely outliving one’s money. Today, retirees can hope to live 30 years or more in retirement. Retirees receiving Social Security constitute a much heavier burden for the work force to bear, placing that income source at risk. This situation is aggravated by the size of the generation entering retirement, which will result in the most new retirees in American history.

The traditional source of retirement income has also shifted, creating new challenges. Krakower notes, “The demise of the old pension plan and the rise of the 401(k) represent a new retirement risk. Now, individuals must cope with the risk that bad investment decisions can have catastrophic consequences for their lifestyle in retirement. Redefining retirement means taking a fresh look at all the assets to which individuals have access, and thinking in new ways about how to put those assets to work to generate lasting retirement income.”

Tuesday, January 26, 2010

Ten Worst Equity Funds of The Decade...

As we begin a new decade, Bloomberg considerately gathered the worst stock funds from the last 10 years. Notably, many of these funds are still recovering from the tech bust early in the decade.

From
Bloomberg: "The 10 worst funds all focused on shares of growth companies, so designated because their sales or earnings are rising faster than their industry’s or the overall market. The group fell -71% on average after the technology bubble deflated. That compared with the -47%  decline by the S&P 500 index from March 24, 2000, to Oct. 9, 2002.”

Here are the 10 worst stock funds based on their performance from Jan. 1, 2000 to Dec. 28, 2009, along with their assets under management, and their percent decline for the period:

Fidelity Growth Strategies; $1.9 billion; -67%

Vanguard U.S. Growth; $4 billion; -50%

Putnam New Opportunities; $2.6 billion; -46%

Columbia Select Large Cap Growth; $1.7 billion; -41%

SEI Large Cap Growth; $2.1 billion; -40%

MFS Growth; $2.1 billion; -39%

Janus Enterprise; $2.4 billion; -38%

Putnam Investors; $1.6 billion; -37%

Seligman Growth; $1.4 billion; -37%

AIM Constellation; $3.1 billion; -37%

Monday, January 25, 2010

Vantage Point UPDATE: Intermediate-Term and Long-Term Trend Analysis


On Friday January 22nd the S&P 500 closed @ 1092, and that was...

  
+5.0% ABOVE its 12-Month moving average which stood @ 1040.

+7.6% ABOVE its 40-Week moving average which stood @ 1015.

-1.7% BELOW its 10-Week moving average which stood @ 1111.

Therefore, the INTERMEDIATE-Term trend IS NEUTRAL and
the LONG-Term trend is BULLISH.

Sunday, January 24, 2010

Status of Our Vantage Point Investment Models


NONE of our Vantage Point Models have changed since the last update.


As of the close on Friday, January 22nd, the status of our Vantage Point Models is as follows:


Our Intermediate-Term Stock Model is NEGATIVE as of May 16, 2008.
Our SmallCap Momentum Model is NEGATIVE as of January 4, 2008.

Our Treasury Bond Model is NEGATIVE as of February 20, 2009.
Our High-Yield Bond Model is POSITIVE as of July 24, 2009.

In our relative strength work, we favor:
  • SmallCap funds over LargeCap funds         (since 12/18/09)
  • Growth funds over Value funds                 (since 01/08/10)
  • U.S. funds over Foreign funds                   (since 11/20/09)
  • SmallCap Value over LargeCap Growth     (since 12/18/09)


Saturday, January 23, 2010

Bullish Omen: Breadth Surge Implies Higher Prices


When the breadth of the market becomes extremely positive over a short period of time (a technical condition referred to as a Breadth Surge or Thrust), such an surge usually has positive implications for the market over the next 3, 6, 9, and 12 months.

The most recent Breadth Thrust BUY signal was triggered on September 16, 2009. According to Ned Davis Research, since 1947 stocks have been higher one year after a Breadth Thrust BUY signal in 28 out of the 29 occurrences.

The one losing signal came in early 1987 and was ruined by the now famous “Crash of ‘87” that occurred 9 months and 6 days after the signal was given. However, it should be noted that stocks were indeed significantly higher 3, 6, and 9 months after the signal.

Of the 28 buy signals that were correct over the last 60+ years, the average gain for the S&P 500 one year after the Breadth Thrust BUY signal has been +17.5%. Yes, there were some underwhelming positive years, but 21 of the 28 years saw double digit gains averaging +22.8%.

The S&P closed on September 16th at 1068.76. This means that if history holds true, the S&P should be +17.5% higher by this September, which would put the index at 1255.79.

Since the S&P closed Tuesday, January 19, @ 1150.23, we could therefore see a further gain of roughly +9% from here.

Friday, January 22, 2010

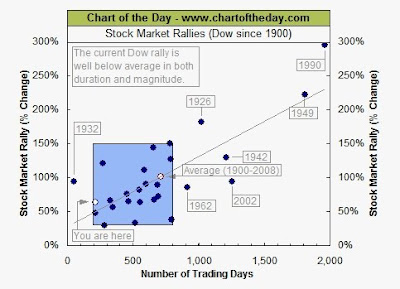
Chart of the Day: Stock Market Rallies Since 1900


"The current Dow rally is well below average in both magnitude and duration."

The Dow made another rally high  in 2010. To provide some perspective to the current Dow rally that began back in March, all major market rallies of the last 110 years are plotted on today's chart. 

Each dot represents a major stock market rally as measured by the Dow. As today's chart illustrates, the Dow has begun a major rally 27 times over the past 110 years which equates to an average of one rally every four years. 

Also, most major rallies (73%) resulted in a gain of between +30% and +150% and lasted between 200 and 800 trading days -- highlighted in today's chart with a light blue shaded box. 

As it stands right now, the current Dow rally (hollow blue dot labeled you are here) has entered the low range of a "typical" rally and would currently be classified as both short in duration and below average in magnitude.
 

Thursday, January 21, 2010

Bullish Omen: % New Highs Establish A New Cycle Peak

Ned Davis Research Reports that the Percentage of New Highs on the New York Stock Exchange hit the highest point of this cycle on January 8th at 26.7%.

Bull markets typically don't expire directly after a peak in the % of New Highs has been reached.

Since 1967, the median lead time between the peak in New Highs and the top of bull markets has been a little more than 7 months.

The fresh peak in New Highs implies that the risk of new bear market is highly likely to be several months away, and market risk is not likely to become problematic until at least the 2nd half of 2010.

Wednesday, January 20, 2010

CARPE DIEM: If European Countries Became U.S. States.....


If various European countries became part of the United States:

1. Portugal would rank #51 as a U.S. state, below Mississippi in per capita GDP.

2. Italy and Greece as U.S. states would rank between the two poorest U.S. states - West Virginia and Mississippi.

3. If France became a U.S. state it would rank #48 out of 51 by per capita GDP, just barely ahead of America's two poorest states - West Virginia and Mississippi.

4. Belgium, Finland, U.K., Germany and Spain would rank in the bottom 20% of U.S. states by per capita GDP, just barely ahead of Arkansas but below Kentucky.

5. Although Netherlands, Sweden and Denmark are among Europe's wealthiest countries, as U.S. states they would be between 14.5% and 18% below the U.S. average.  

The chart below provides some additional perspective on Europe's "economic success," based on data available here that compares 2007 GDP per person on a purchasing power parity basis for U.S. states and European countries...


Tuesday, January 19, 2010

Vantage Point UPDATE: Intermediate-Term and Long-Term Trend Analysis


On Friday January 15th the S&P 500 closed @ 1136, and that was...

  
 +8.5% ABOVE its 12-Month moving average which stood @ 1047.

+12.6% ABOVE its 40-Week moving average which stood @ 1009.

 +2.3% ABOVE its 10-Week moving average which stood @ 1111.

Therefore, the INTERMEDIATE-Term trend IS NEUTRAL and
the LONG-Term trend is BULLISH.

Monday, January 18, 2010

Senior Citizens On Love & Relationships

  • 16% — Percentage of people 65 or older who say they could fall "head over heels" in love; 39% say they have already done so.

  • 44% — Percentage of people over 65 who say romance becomes more important as you age.


  • 89% — Percentage of people 65 or older who are married to the person they are in love with; 2% say that person is no longer living. Only 1% say they are living with, but not married to, the person they are in love with.


  • 27% — Percentage of older adults who say they would be willing to leave their profession for someone they love; 22% would move to another country.
Source: AARP

Sunday, January 17, 2010

Status of Our Vantage Point Investment Models

As of the close on Friday, January 15th, the status of our Vantage Point Models is as follows:

Our Intermediate-Term Stock Model is NEGATIVE as of May 16, 2008.
Our SmallCap Momentum Model is NEGATIVE as of January 4, 2008.

Our Treasury Bond Model is NEGATIVE as of February 20, 2009.
Our High-Yield Bond Model is POSITIVE as of July 24, 2009.

In our relative strength work, we favor:
  • SmallCap funds over LargeCap funds         (since 12/18/09)
  • Growth funds over Value funds                 (since 01/08/10)
  • U.S. funds over Foreign funds                   (since 11/20/09)
  • SmallCap Value over LargeCap Growth     (since 12/18/09)


Saturday, January 16, 2010

National Debt Is Soaring Relative to GDP

Is The Economic Foundation Of The U.S. Crumbling?


U.S. National debt as a percentage of GDP has been climbing steadily since 2000, and has seen exponential growth in the last two years.  At the current ratio of 83.5% debt to GDP, we are at a level not seen since the 1950s. This metric is presented in the chart below going back 90 years. 

By the end of 2010, this ratio is projected to be near 100% of GDP absent a dramatic shift in domestic budgetary policy.

As with any borrowing, the more a person, entity or company borrows, even the United States of America, the higher their cost of borrowing will go, all else being equal.  


Interestingly, the national debt of $12.17 trillion, actually excludes Fannie Mae and Freddie Mac debt. The U.S. government became the effective conservator of both of these entities with the Housing and Economic Recovery Act of 2008.  

The estimated combined on and off balance sheet debt of Fannie and Freddie is purported to be just over $5 trillion. 

Including this additional $5 trillion in debt, U.S. Government debt as a percentage of GDP is actually more than 120%

On that basis, U.S. government debt as a percentage of GDP is the highest ratio it has ever been, or at least since the numbers have been recorded, which is since 1792. Needless to say, both ever, and since 1792, are a long time.

Globally, this data hasn't been updated since 2008, but based on 2008 data, the U.S. has the 5th highest indebtedness as a percentage of GDP, just barely above Singapore and just below Jamaica, man.  The only other countries more indebted than the U.S., on this basis, are the economic stalwarts of Zimbabwe, Japan, and Lebanon. . .

Keep your eyes on U.S. government debt . . . this Queen Mary is not turning any time soon and will hold investment implications related to many asset classes for years to come. 

We cannot increase our debt exponentially without increasing our borrowing costs.


Friday, January 15, 2010

VIX At Lowest Level Since 2008...


Now that the VIX Index is at its lowest levels since May 2008, and down nearly -80% from its record high in late 2008, there is a growing concern among some investors that there is not enough fear in the marketplace.
  
As the chart above indicates, the current level of 17.6 is lower than the long-term average of 20.3 since 1990.

However, during the mid-nineties and the middle part of this decade, which were both good periods for equity investors, the VIX not only traded at and below current levels, but it also remained at those levels for several years.


While the VIX's decline over the last year indicates that investors are not as fearful as they were a year ago, can you blame them for not being so?

While conditions haven't quite returned to normal, they are a lot closer now than they were then.

Chart and analysis courtesy of Bespoke Investment Group


Thursday, January 14, 2010

Annuities vs. Certificates of Deposit (CDs)


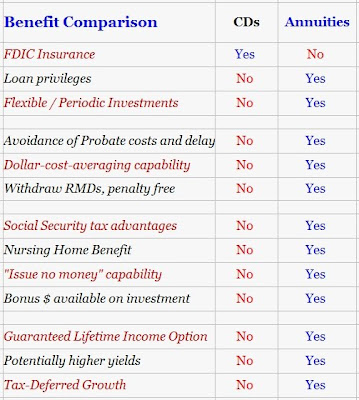
Annuities and CDs (bank certificates of deposit) are similar in that they are safe, secure investments with guaranteed rate of returns based on interest rates, both issued by large financial institutions, CDs issued by banks, Annuities offered by insurance companies, but they both possess inherent differences as well.

The big differences are that while Annuities offer everything CDs offer, they carry several advantages.

    1. Generally Higher returns
    2. Tax-Deferral
    3. Liquidity
CDs do have FDIC protection to guard against bank or banking industry failure. Annuities also have safety measures put in place by the state to ensure Insurance companies have reserve pools in place.

Insurance companies may also be vetted for financial strength by obtaining their rating from objective rating firms -- Standard & Poor's, Moody's, A.M. Best or Duff & Phelps . The more solid the rating usually equates to a more solid financial backbone for the insurance company.

Higher Returns:
Annuities, like CDs, are hinged to interest rates. But when rates are low so are CD returns whereas annuities have a minimum guarantee in place, usually 3% or 4%. Your investment will never dip below the guaranteed minimum interest rate during times of falling or low interest rates. 


Again, low interest rates mean CD returns will be low as well. To offset the problem of low or falling interest rates, insurance companies equip annuities with guaranteed minimums. This is an agreed minimum rate of interest so that your investment is assured not to fall below the minimum performance even if CD rates do.

Tax-Deferral:
You pay annual taxes on CD interest earned without being able to withdraw funds until your investment term is over. With annuities, there is also a set term, but the earnings are tax-deferred. You only pay taxes on interest earned when money is withdrawn.

So with annuities the deferred tax on your interest remains in the investment earning you more and more money, instead of being paid out to state and federal tax agencies on a yearly basis. 


Liquidity:
CDs do not allow you to withdraw any monies during term. Period. Annuities have provisions that allow you to withdraw money, generally 10% of your account value annually plus many contracts allow you to remove the earned interest on a monthly basis.

Several other annuity contract provisions allow you access to all of your funds such as in the event you are hospitalized, undergoing a life-threatening illness, subjected to a permanent or extended stay in a nursing home, or other major calamities that affect you economically.

In addition, annuities can be structured to pay-out for the life of the owner over a fixed term such as 5 or 10 years, thereby spreading out your tax-burden and providing enhanced income security.

In short, Annuities offer enhanced flexibility... 


Wednesday, January 13, 2010

Top 5 Reasons NOT To Retire

There are almost as many reasons to keep working as there are to retire – work adds meaning to your life, enhances your social life, and the shock of suddenly spending all day, every day with your spouse can make even the closest couples a little crazy.

U.S. News and World Report highlights some of the more tangible reasons to stay in the work force.

1. Working is good for your health.
The Journal of Occupational Health Psychology reported earlier this year that seniors who work part-time in retirement suffer fewer major diseases than people who give up working altogether.

2. Take advantage of employee benefits. The Employee Benefit Research Institute estimates that a married couple over 65 will need $210,000 to have only a 50% change of being able to afford their medical needs. Some jobs offer special perks like employee discounts, on-site clinics, or fitness centers are worth more than just the salary.

3. Delay taxes. Delaying withdrawals from retirement accounts delays the tax you have to pay on that income, and gives the account more time to accrue assets.

4. You need more income. About three-quarters of workers over 55 have saved less than $250,000 according to Employee Benefit Research Institute. If retirement could last another decade or two, seniors may need a few more years to build up that retirement fund.

5. A bigger Social Security check is always nice. Each year you delay signing up for Social Security increases your benefit by 7% to 8% percent.

Tuesday, January 12, 2010

Sentiment Becoming Frothy and Historically Bearish

  • Options traders last week bought 2.5 times more call options than put options, the highest ratio since September 2000.

  •  The last time traders spent more than 4 times the money to buy call options as put options, the S&P 500 peaked and didn't set another 52-week high for
    2 months.

High-Yield Bonds Continue To Outperform


Over the past month or so, the only area of the bond market that has done well is junk.

  
Both Treasuries and investment grade corporates have struggled, while high yield bonds have continued to surge.

Below we highlight a 6-month performance chart of the high yield bond ETF (HYG) and the investment grade corporate bond ETF (LQD).

As shown, HYG is up +18.2% over the last six months, while LQD is only up +5.5%.

You can see a clear split in performance (shaded in gray) at the start of December, where HYG continued to trade higher and LQD began to trade lower.


Chart and analysis courtesy of Bespoke Investment Group


Monday, January 11, 2010

Chart of The Day - Job Growth Plunges in the 2000s Decade


On Friday, January 8, 2010, the U.S. Labor Department reported that nonfarm payrolls (jobs) decreased by 85,000 in December while the data for November was revised upward and now shows a gain of 4,000 jobs.

For some perspective, the chart herein illustrates the percent increase in the number of jobs for every decade since the 1940s (the data goes back to 1939).

As today's chart illustrates, the number of jobs at the end of a decade has been anywhere from +20% to +38% greater than 10 years prior.

That +20% plus growth has been the case until the decade just passed during which the number of jobs basically ended the year where it began.

This subpar job growth is particularly noteworthy due to the fact that the U.S. population has increased by +10% in addition to a significant increase in global wealth during the same time frame.

Saturday, January 9, 2010

Status of Our Vantage Point Models - ONE Model Change!


This week we have ONE Vantage Point Model change.


On Friday, January 8th, our Growth vs Value Switching Model began to Growth funds over Value funds for the first time since November 13, 2009.

As of the close on Friday, January 8th, the status of our Vantage Point Models is as follows:

Our Intermediate-Term Stock Model is NEGATIVE as of May 16, 2008.
Our SmallCap Momentum Model is NEGATIVE as of January 4, 2008.

Our Treasury Bond Model is NEGATIVE as of February 20, 2009.
Our High-Yield Bond Model is POSITIVE as of July 24, 2009.

In our relative strength work, we NOW favor:
  • SmallCap funds over LargeCap funds         (since 12/18/09)
  • Growth funds over Value funds                 (since 01/08/10)
  • U.S. funds over Foreign funds                   (since 11/20/09)
  • SmallCap Value over LargeCap Growth     (since 12/18/09)


Friday, January 8, 2010

6 Roth IRA Conversion Mistakes & How To Avoid Them


There are plenty of reasons you may be interested in converting your Traditional IRA to a Roth IRA. Higher-income investors IRA investors are no longer excluded from converting their accounts, and income taxes due on the conversion can be spread over two years.


There are several missteps, however, that could derail a successful conversion.

Robert Powell, writing for MarketWatch.com, describes 6 mistakes to avoid when converting a Traditional IRA to a Roth IRA.

1. Neglecting to do the conversion. Powell cites Beverly DeVeny, an IRA technical consultant with Ed Slott and Company LLC, who asks, "Why would you not want to pay taxes today at known -- probably very low rates -- to get tax-free income at a later date (probably at higher and maybe much higher rates)?” She recommends investors who don’t want to convert their entire IRA at once at least convert a portion of it.

2. Failing to understand tax consequences. Powell calls Roth IRAs the opposite of traditional IRAs. The Roth IRA is funded with after-tax dollars, and distributions aren’t taxed; the traditional IRA uses pre-tax dollars and distributions are taxed. “The additional income from the distribution of the traditional IRA would most likely bump you into a higher tax bracket,” he writes.

3. Converting when you are likely to be in a lower tax bracket. If it’s likely that you will slip into a lower tax bracket, you should hold onto your traditional IRAs.

4. Having taxes owed withheld from the transaction. Powell turns to Denise Appleby, chief executive of Appleby Retirement Consulting, who warns against withholding taxes from a conversion. The amount withheld reduces the conversion amount, and is subject to the 10% early distribution penalty, unless you are older than 59 ½ when you convert the accounts. Furthermore, if you decide later that they want to reverse the conversion, you can only reverse what was originally credited to the new Roth IRA. If anything was withheld for taxes, that portion would be taxed as a distribution from a traditional IRA.

5. Converting to just one Roth IRA. Powell suggests that investors convert traditional IRAs into as many Roth IRA accounts as possible, with investments of a similar type. “With Roth IRA conversions,” he writes, “Uncle Sam lets you switch back to a traditional IRA before a certain date should the value of the account fall below the original conversion amount.”

6. Forgetting to consider a recharacterization. If the value of the converted Roth IRA falls significantly, you have some tax-saving opportunities if you undo the conversion. Income tax is owed on the entire pre-tax amount that was converted, even if the market value falls below the original amount.

"The good news is that taxable conversion transaction can be reversed (recharacterized), if it is done by your tax filing deadline, including applicable extensions,” according to Appleby.

“The recharacterization can be done, even if your tax return has already been filed, as an amended tax return can be filed to reflect the removal of the conversion from the individual's taxable income.”

Thursday, January 7, 2010

Inflation: A Threat or Not? - Answers to 5 Key Questions


The rate of inflation in an economy—increases in the prices for goods and services—is of particular importance to investors because it erodes portfolio purchasing power and historically has affected the returns to stocks and bonds.


• Though rapid money supply growth and huge fiscal deficits represent potential inflationary pressures on the horizon, there remains little inflation in the near-term outlook due to a weak U.S. economy, deleveraging, and banks’ unwillingness to increase lending.

• The timing and magnitude of future inflationary pressures will depend on the Federal Reserve’s exit strategy and other uncertain factors, but there is greater risk that inflation rates rise from low current levels in the coming years.

• High unemployment makes the risks of a near-term return to a 1970s-style, wage-push inflationary outbreak unlikely, with a commodities induced,early-2008 scenario more plausible.

• Investors may hedge against potentially higher inflation by allocating capital to asset categories that historically have held up better during times of high or accelerating inflation. 

The link to the PDF article from Market Analysis, Research & Education (MARE) by Dirk Hofschire, CFA, at the bottom of this post provides answers to the following questions about inflation that serious investors should be contemplating in the current environment:
  •  1.    Is inflation accelerating?
  •  2.    Why is higher inflation expected?
  •  3.    Why hasn’t inflation occurred yet?
  •  4.    When will inflation return?

Wednesday, January 6, 2010

Stock Market's Strong Start in 2010 A Bullish Omen for the Remainder of The Year


According to Schaeffer’s Investment Research, a gain of +1% or more on the first trading day of the year has been a good sign for the rest of the year.

Since 1973, when the S&P 500 has gained more than +1% in the first session, the market has ended the year higher 86% of the time – with the average gain on the year coming in at +14.7%.

Tuesday, January 5, 2010

CARPE DIEM: Why We Have a Health Care Cost Problem and Why It Will Only Get Worse: Other People's Money


The chart above shows why we have a health care cost problem. 


Patients have little direct connection in paying for their care, and their role has fallen significantly. Meanwhile, the government's involvement has grown, as has that of the insurance industry.

"By not knowing the full costs associated with health care, consumers demand more and overuse it," Kenneth E. Thorpe explained a few years back in Health Affairs.

The Champion's Creed - An Inspirational Affirmation for 2010


"I am not judged by the number of times I fail, but by the number of times I succeed.


And the number of times I succeed is in direct proportion to the number of times I can fail and keep on trying."


- Tom Hopkins

Monday, January 4, 2010

Q&A: How to Prepare for a Slow Roth IRA Conversion @ WSJ.com

Ask Encore @ WSJ.com
Focus on Retirement - By KELLY GREENE


Q: I'm 60 years old and plan on converting portions of my IRA to a Roth yearly, over the next 10 years. My question is: Should I convert the winners or losers first?

—Karen Quandt, Maryville, TN

A: When considering converting investments to a Roth IRA from a traditional individual retirement account, past performance is less important than what you anticipate in the future.


"I would say to convert the losers, if you expect them to become winners, and focus first on the ones you think are going to appreciate the fastest," says Ed Slott, an IRA consultant in Rockville Centre, N.Y.


First, the basics: Starting January 1, 2010, the $100,000 income limit disappears for converting traditional IRAs and employer-sponsored retirement plans to Roth IRAs. Although the conversion is subject to income tax, future withdrawals (that meet holding requirements) would be tax free.

With that in mind, let's go back to your winners-and-losers strategy: If you hold an investment with appreciation potential, or that you consider beaten down or depressed in value, it makes sense to convert it to a Roth, Mr. Slott says. That way, you won't have to pay tax on any increase in value.

Conversely, if you are holding an investment at or near an all-time high, such as a stock you bought for $20 that has climbed to $100, "that may not be the one to convert," he says.

You also might consider opening a separate Roth for each type of investment you make with the converted investments. That way, you could cherry-pick the so-called losers by "recharacterizing" any Roth IRA investments that lose value, Mr. Slott says. Even if your predictions turn out wrong, and the converted Roth assets fall in value, you are allowed to recharacterize the account as a traditional IRA and no longer owe the tax.

For example, let's say you made two types of investments, one that doubled in value and another that lost everything. If those investments were in the same Roth, the account value would appear unchanged. But if they were in separate accounts, you could recharacterize the one that suffered—and allow the one doing well to continue appreciating in value as a Roth.

(The deadline for recharacterizing IRA assets converted to a Roth in 2010 is October 15, 2011.)

One other note: As our reader recognizes, a Roth conversion isn't an all-or-nothing option.

One way to mitigate the tax-bill pain is to do incremental conversions across a number of years.

You might even want to get your accountant to help you figure out how much you could convert within your current tax bracket each year without bumping yourself into a higher one.


Write to Ask Encore at encore@wsj.com

Sunday, January 3, 2010

Status of Our Vantage Point Investment Models

As of the close on Friday, January 1st, the status of our Vantage Point Models is as follows:

Our Intermediate-Term Stock Model is NEGATIVE as of May 16, 2008.
Our SmallCap Momentum Model is NEGATIVE as of January 4, 2008.

Our Treasury Bond Model is NEGATIVE as of February 20, 2009.
Our High-Yield Bond Model is POSITIVE as of July 24, 2009.

In our relative strength work, we favor:
  • SmallCap funds over LargeCap funds         (since 12/18/09)
  • Value funds over Growth funds                 (since 11/13/09)
  • U.S. funds over Foreign funds                   (since 11/20/09)
  • SmallCap Value over LargeCap Growth     (since 12/18/09)


Saturday, January 2, 2010

The Optimist's Creed - A Daily Affirmation for 2010


The Optimist's Creed

I Promise Myself...


  • To be so strong that nothing can disturb my peace of mind.

  • To talk health, happiness, and prosperity to every person I meet.

  • To make all my friends feel that there is something worthwhile in them.

  • To look at the sunny side of everything and make my optimism come true.

  • To think only of the best, to work only for the best and to expect only the best.

  • To be just as enthusiastic about the success of others as I am about my own.

  • To forget the mistakes of the past and press on to the greater achievements of the future.

  • To wear a cheerful expression at all times and give a smile to every living creature I meet.

  • To give so much time to improving myself that I have no time to criticize others.

  • To be too large for worry, too noble for anger, too strong for fear, and too happy to permit the presence of trouble.

  • To think well of myself and to proclaim this fact to the world, not in loud word, but in great deeds.

  • To live in the faith that the whole world is on my side, so long as I am true to the best that is in me.
- Christian D. Larson


A somewhat different and shortened version of this was adopted by Optimist International, which publishes it on its website, with the following statement:

Many have found inspiration in The Optimist's Creed. In hospitals, the creed has been used to help patients recover from illness. In locker rooms, coaches have used it to motivate their players.

Optimist International adopted this creed in 1922. It was originally published in 1912 in a book titled: "Your Forces and How to Use Them."  The author was Christian D. Larson, a prolific writer and lecturer who believed that people have tremendous latent powers, which could be harnessed for success with the proper attitude.

Link to Printable PDF - The Optimist's Creed

Link to Optimist's Creed SLIDESHOW

Friday, January 1, 2010

Quote of the New Year: Freedom vs. Happiness


"Doing what you like is freedom."

"Liking what you do is happiness."
 
-Frank Tyger