Monday, February 27, 2017
Vantage Point UPDATE: Intermediate-Term and Long-Term Trend Analysis
On Friday, February 24, the S&P 500 closed @ 2367, and that was...
+8.2% ABOVE its 12-Month moving average which stood @ 2188.
+8.2% ABOVE its 40-Week moving average which stood @ 2188.
+3.2% ABOVE its 10-Week moving average which stood @ 2295.
Therefore, the INTERMEDIATE-Term trend is BULLISH
and the LONG-Term trend is BULLISH.
Labels:
intermediate-term,
long-term,
trend,
Vantage Point
Friday, February 24, 2017
CBO: Social Security Trust Fund Gone In 2029

The problem is that entitlement spending will grow faster than the economy and tax revenue, fueled by an aging population, rising health care costs and expanding ObamaCare enrollment.
Read More At Investor's Business Daily:
http://news.investors.com/politics/061615-757616-social-security-trust-fund-ends-in-2029-autopilot-spending.htm#ixzz3dLzNQCpA
Labels:
Medicaid,
medicare,
ObamaCare,
Social Security
Wednesday, February 22, 2017
Monday, February 20, 2017
Vantage Point UPDATE: Intermediate-Term and Long-Term Trend Analysis
On Friday, February 17, the S&P 500 closed @ 2351, and that was...
+7.9% ABOVE its 12-Month moving average which stood @ 2180.
+7.6% ABOVE its 40-Week moving average which stood @ 2186.
+2.9% ABOVE its 10-Week moving average which stood @ 2284.
Therefore, the INTERMEDIATE-Term trend is BULLISH
and the LONG-Term trend is BULLISH.
Labels:
intermediate-term,
long-term,
trend,
Vantage Point
Friday, February 17, 2017
Putting America's $18 Billion Economy in Global Perspective

The map above was created by matching economic output in US states in 2014 to foreign countries with comparable nominal GDPs, using BEA data for GDP by U.S. state and GDP by country from the International Monetary Fund, via Wikipedia here.
For each U.S. state (and the District of Columbia), Carpe Diem tried to find the country closest in economic size in 2014 (measured by nominal GDP), and for each state there was a country with a pretty close match – those countries are displayed in the map above and in the table below.
Obviously, in some cases the closest match was a country that produced slightly more, or slightly less, economic output in 2014 than a given U.S. state.
It’s pretty amazing how ridiculously large the US economy is, and the map above helps put America’s GDP of nearly $18 trillion in 2014 into perspective by comparing the GDP of U.S. states to other country’s entire national GDP.
Wednesday, February 15, 2017
How Medicare Taxes Impact Upper-Income People
When you hear "Medicare Taxes," you probably don’t think about your investments.
But these taxes affect many upper-income Americans with higher taxes on both wages and investment income. All the more reason to have a tax-smart financial plan in place.

There are TWO ways the Medicare Taxes affect upper-income people.
First, a 3.8% Medicare surtax is levied on the lesser of net investment income or the excess of modified adjusted gross income (MAGI) above $200,000 for individuals, $250,000 for couples filing jointly, and $125,000 for spouses filing separately.
Second, wages above $200,000 (individuals), $250,000 (joint filers), and $125,000 (spouses filing separately) will be subject to higher payroll taxes.
Monday, February 13, 2017
Vantage Point UPDATE: Intermediate-Term and Long-Term Trend Analysis
On Friday, February 10, the S&P 500 closed @ 2316, and that was...
+6.2% ABOVE its 12-Month moving average which stood @ 2180.
+6.6% ABOVE its 40-Week moving average which stood @ 2172.
+1.8% ABOVE its 10-Week moving average which stood @ 2275.
Therefore, the INTERMEDIATE-Term trend is BULLISH
and the LONG-Term trend is BULLISH.
Labels:
intermediate-term,
long-term,
trend,
Vantage Point
Friday, February 10, 2017
Case Study: Managing Taxation on Retirement Income Withdrawals
Example: How to Manage Taxes on Withdrawals for Retirement Accounts.

This hypothetical example is for illustrative purposes only. This hypothetical scenario assumed the couple does not receive Social Security benefits. Social Security income would further complicate the tax scenario described above and should be considered when creating a withdrawal strategy.
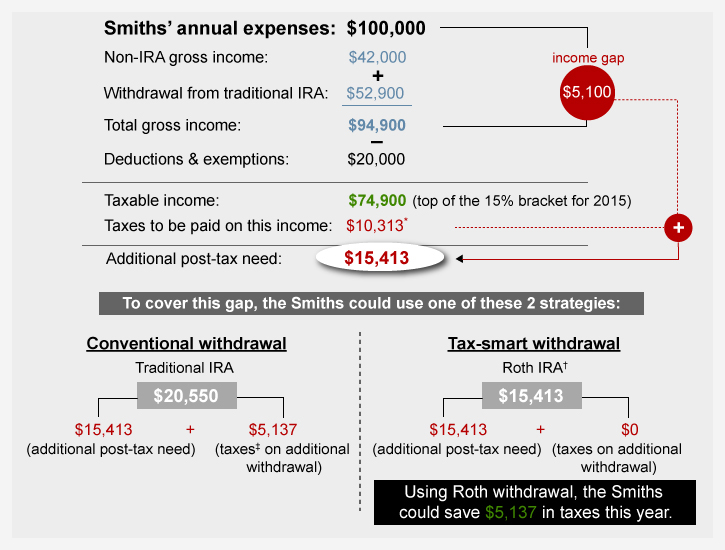
As a way to help minimize the taxes you’ll pay, consider the following hypothetical scenario. It illustrates the way a retired married couple whose annual expenses total $100,000 might seek to manage their taxes.
Our hypothetical couple expects $42,000 in gross income (all taxable) before tapping their retirement accounts, so their gross income gap—(before considering taxes)—is $58,000. They anticipate $20,000 in deductions and exemptions, so their expected taxable income before withdrawals is $22,000. If they withdraw $52,900 from their traditional IRAs, it would bring their taxable income to $74,900—the top of the 15% bracket. They could then withdraw the remaining $5,100 that they need to cover their income gap from a Roth IRA, which does not generate taxable income (assuming the withdrawal is qualified). The chart (above) shows their cash flow and taxable income.
Our hypothetical couple expects $42,000 in gross income (all taxable) before tapping their retirement accounts, so their gross income gap—(before considering taxes)—is $58,000. They anticipate $20,000 in deductions and exemptions, so their expected taxable income before withdrawals is $22,000. If they withdraw $52,900 from their traditional IRAs, it would bring their taxable income to $74,900—the top of the 15% bracket. They could then withdraw the remaining $5,100 that they need to cover their income gap from a Roth IRA, which does not generate taxable income (assuming the withdrawal is qualified). The chart (above) shows their cash flow and taxable income.
Other Options for Our Hypothetical Couple
The hypothetical couple in this scenario leaves the bulk of Roth IRA assets alone, leaving them in place to potentially generate tax-free growth. In certain situations, however, it may be advantageous to tap Roth assets instead of tax-deferred or taxable accounts. These include situations when:
- Any distributions at all from a tax-deferred account would cause your taxable income to exceed your target marginal tax rate
- Withdrawing from a taxable account would require selling assets held less than a year, resulting in short-term capital gains, which are taxed at ordinary income tax rates
- You are also trying to minimize taxes on Social Security benefits, withdrawals from a tax-deferred account would have an impact on the taxability of those benefits
Your circumstances may be considerably different from those described in the scenario. Nevertheless, you may be able to apply the principles to your own situation. A tax professional can help you explore the implications of different withdrawal strategies, help minimize the amount of taxes you pay on hard-earned savings, and, of course, help you maximize your ability to live the retirement you envision.
Labels:
income,
IRA,
marginal tax rates,
retire,
retiree,
retirement,
retirement plan,
Roth,
Social Security,
tax,
taxation,
taxes
Wednesday, February 8, 2017
How Life Expectancy Is Reshaping Retirement Planning...
How rapidly has longevity changed, and how has that shift affected society?
Life was short.
By the mid-1800s life expectancy had reached the mid-30s in the United States, and in 1900 it was 47 years.
By the end of the century, life expectancy had reached 77 years. By the mid-1800s life expectancy had reached the mid-30s in the United States, and in 1900 it was 47 years.
It gained 30 years in one century—that’s unprecedented.
More years were added to average life expectancy in the 20th century than all the years added in all prior millennia of human evolution combined!
Most of the gains in the first half of the century resulted from reducing childhood mortality, but since 1950 life expectancy at 65 has been rising as well. In fact, life expectancy has increased by about three months a year for some time.
Most people are thinking about growth in longevity in terms of an aging population’s burden on society. But I think we have the opportunity to look at it another way— to reshape current models so that we live decades longer than our ancestors in a way that improves quality of life at all ages.
How might we reshape our understanding of retirement to suit longer lives?
We’re going to completely redefine retirement or get rid of the concept altogether. The old model just won’t work anymore. Most people can’t save enough in 40 years of working to support themselves for 30 or more years of not working. Nor can society provide enough in terms of pensions to support nonworking people that long.

Labels:
life expectancy,
longevity,
planning,
retirement
Monday, February 6, 2017
Vantage Point UPDATE: Intermediate-Term and Long-Term Trend Analysis
On Friday, February 3, the S&P 500 closed @ 2297, and that was...
+5.5% ABOVE its 12-Month moving average which stood @ 2177.
+6.1% ABOVE its 40-Week moving average which stood @ 2166.
+1.5% ABOVE its 10-Week moving average which stood @ 2263.
Therefore, the INTERMEDIATE-Term trend is BULLISH
and the LONG-Term trend is BULLISH.
Labels:
intermediate-term,
long-term,
trend,
Vantage Point
Friday, February 3, 2017
Wednesday, February 1, 2017
Subscribe to:
Posts (Atom)


