Monday, November 30, 2009

40.9% of the Cost of Your Thanksgiving Dinner is Brought to You Courtesy of the Government

Courtesy of the Americans for Tax Reform Center for Fiscal Accountability


According to the American Farm Bureau Federation, the average cost for a Thanksgiving feast for ten lies at $42.91 in 2009. The menu items for a classic Thanksgiving dinner used for their survey include turkey, bread stuffing, sweet potatoes, rolls with butter, peas, cranberries, a relish tray of carrots and celery, pumpkin pie with whipped cream, and beverages of coffee and milk.

Of that, of course, the turkey is the largest cost factor at an average price of $18.65 for a 16-pound bird.

Because Thanksgiving is a celebration, for our calculations, we also factored in five bottles of wine at an average price of $7.35, which brings the total cost of the average Thanksgiving feast to $79.67.

But not all of that reflects the actual cost of your meal – a large chunk of it is taken by the government in some form or another:

On top of the direct excise taxes on the wine, there are taxes paid by the farmers, winemakers, manufacturers, wholesalers, distributors and shippers, retailers, warehouses.

To be more specific, out of what the consumer pays, the producers and sellers must pay federal income taxes, state income taxes, federal payroll taxes, unemployment insurance taxes, workmen’s compensation taxes, state franchise taxes, local property taxes and any local income taxes.

All told, for a Thanksgiving feast for a family of ten, the government takes a bite of 40.9%, or $32.59.

And that is only if your family does not have to drive or fly to get to the Thanksgiving party, or stay at a hotel for the duration of the festivities, as domestic airfare, gasoline, and hotel stays have their own “tax bites” which are even higher than the bite the government takes out of your Thanksgiving meal.

http://www.fiscalaccountability.org/point-percent-cost-thanksgiving-dinner-brought-a1039#

http://www.fiscalaccountability.org/tax-bites

Sunday, November 29, 2009

Q&A: Nuts and Bolts of Five-Year Rule on Roth IRAs - WSJ.com

Ask Encore @ WSJ.com
Focus on Retirement - By KELLY GREENE

Q: Could you explain how the five-year rule for Roth IRA conversions works and how it differs from the five-year rule for contributions to Roths?

Do multiple conversions over a period of time trigger a new five-year waiting period for each conversion?

Does attaining age 59½ have an effect?


—Stephen Turbin, North Miami, Fla.

A: For withdrawals to be penalty free, the five-year rule governing Roth IRAs for the most part works the same for people who open and begin periodic contributions to a Roth IRA and those who convert to a Roth from a traditional individual retirement account or other retirement plan. But as with all things involving IRAs, there is a wrinkle or two.

Let's start with the person who opens a Roth and makes periodic contributions. That person can withdraw those original contributions anytime with no tax or penalty. The five-year clock for earnings on those contributions starts January 1 of the year for which your first Roth contribution was made, and it doesn't reset each time you make a contribution or open another Roth. You have to turn 59½ to avoid a 10% penalty for early withdrawals on any earnings, and also to avoid income tax on those earnings.

As for the person who converts to a Roth: In a conversion, you have to hold the assets in a Roth for five years or until turning 59½, whichever comes first, to make penalty-free withdrawals of your converted amounts. Here, each conversion has its own five-year clock.

If you already are 59½ and you convert traditional IRA assets to a Roth, you can withdraw the assets you convert at any time without worrying about a five-year deadline or penalties.

Again, it is a different story with any earnings on those assets: You have to have held a Roth account for five years to withdraw any earnings tax free. But you generally don't need to worry about separating the converted funds from the earnings, since the withdrawal rules for Roth IRAs say that any distributions first come from contributions, then from conversions, and finally from earnings, says Ed Slott, an IRA consultant in Rockville Centre, N.Y.

Rules are spelled out in IRS Publication 590, "Individual Retirement Arrangements," at http://www.irs.gov/. See page 69 under "Ordering Rules for Distributions."

Let's say that 10 years ago, you put $100 into a Roth IRA and now you are 62. That means you have met the age requirement and the five-year-holding requirement for withdrawing your contribution and any earnings with no penalty or tax, Mr. Slott says.

Now, let's say you still have that $100 Roth, and you also convert $100,000 from a traditional IRA to a Roth. (Of course, you pay taxes on the conversion.) You could then withdraw the $100,000 with no tax or penalty, because it is considered to have been held for five years, Mr. Slott says. "The five-year period started the first day you opened that Roth IRA 10 years ago, so you could take out that $100,000 any time."

If you are younger than 59½, though, you could run into trouble: Let's say you're 40 and you opened a Roth 10 years ago with $100. Now you convert $100,000 to a Roth IRA. If you withdraw that $100,000 a year later, at age 41, you owe a 10% penalty on all the converted funds. Even though the account has been open five years, each conversion starts a five-year clock -- until you turn 59½. (You wouldn't owe tax on that amount, though, because it is generally due for the year of the conversion.)

Write to Kelly Greene at kelly.greene@wsj.com

www.WSJ.com

Saturday, November 28, 2009

Two More Problems with Option ARMs

The Option ARMs we referred to in the previous post were most popular in bubble markets -- California, Nevada, Florida and Arizona -- where double digit home annual price increases put the cost of buying a home out of reach. That means the markets where they'll produce the most foreclosures are among the most vulnerable in the nation.

Home prices in many of the markets where option ARMs are most concentrated have fallen -30%, -40% or more.

When the loans recast, most borrowers will find themselves severely underwater.

"Because borrowers of [options-ARMs] are in a much worse position," said Westerback. "You'll see defaults rising very rapidly."

And most option-ARM borrowers will not be good candidates for refinancing or mortgage modifications because their loan-to-value ratios will be far too high. Under the administration's Making Home Affordable program, for example, mortgages with balances that exceed +125% of the home's value are not eligible for help.

But here's the kicker: "Upwards of 80% of were stated-income loans," said Westerback. These are the so-called "liar loans" in which lenders did not verify that borrowers earned as much money as they said they did, so lenders may not be able to modify mortgages because many of the borrowers' income could not stand up to the scrutiny.

And borrowers may not want to go through underwriting again because they could be held legally liable for deliberate inaccuracies on their original applications.


Add to those conditions the still fragile economy and high unemployment rates, and you have a recipe for disaster.


Next Wave of Foreclosures Coming?

According to a new report released this week by Standard & Poors (S&P), 93% of option-ARM buyers selected the worst, most irresponsible, option.

Given a choice of which to pay: interest and principal, interest only, or a minimum amount less than the interest due; almost everyone paid the minimum -- presumably in hopes that the value would keep going up.

Nearly all of the 350,000 option-ARM borrowers owe more than when they first bought their homes thanks to the unpaid interest accumulating, and many loans written during the first big wave, which started in 2004, are getting ready for their five-year reset when they become standard amortizing loans. Some newer loans will even reset early if the accumulated interest has pushed the loan-to-value ratio above 110% to 125%.

That will change things -- in one scenario outlined in the S&P report, the payment on a $400,000 mortgage jumps from $1,287 to $2,593.

Some industry pessimists say the looming default problem could have the power to derail the nascent housing market recovery. "The crux of the matter is that as soon as these mortgages recast, the history is that they will default," said Brian Grow, one of the S&P report's coauthors.

The last year that any option-ARMs were issued was 2007. In the first 20 months after issuance, this vintage of option-ARMs had an average default rate of just over 22%.

But if you calculate only default rates for 2007 option-ARM borrowers who are now underwater, the default rate jumps to 25% after just 20 months, according to S&P.

So, regardless of how many of these kinds of loans there are out there, their high default rates will have an outsized influence on housing markets, adding to already bloated foreclosure inventories and driving prices down further.


Bankruptcies Up +33%

The American Bankruptcy Institute (ABI), an industry research firm, said 388,485 bankruptcies were filed during the last quarter, compared to 292,291 filed during the same period in 2008, according to data released by the Administrative Office of the U.S. Courts.

That's 33% -- the highest level since 2005, when 2,078,415 were filed before Congress passed amendments to the Bankruptcy Code.

Filings for the first nine months of the year climbed 35% to 1,100,035, compared to 841,496 filings during the same period in 2008. A total of 1,117,771 bankruptcies were filed last year. The ABI report said business bankruptcy filings rose 32% in the third quarter of 2009 to 15,177, and filings for the first nine months of the year totaled 45,510, topping the total 43,546 business bankruptcies filed in 2008.

Personal bankruptcies increased 33% to 373,308 during the last quarter, led by a 42% hike in Chapter 7 filings, which totaled 265,721.

The number of consumers filing Chapter 13 bankruptcies rose 15% to 107,142 filings in the third quarter, according to ABI.

"The spike in bankruptcy filings for both consumers and businesses reflect the continuing effects of today's weak economy," said ABI executive director Samuel Gerdano in a statement. "With unemployment surpassing 10% and credit to businesses remaining tight, consumers and businesses are increasingly turning to the financial relief of bankruptcy."


Wednesday, November 25, 2009

Chart of the Day: Gold & The U.S. Dollar


Chart Courtesy of www.ChartOfTheDay.com

"Regardless of the dollar price involved, one ounce of gold would purchase a good-quality man's suit at the conclusion of the Revolutionary War, the Civil War, the presidency of Franklin Roosevelt, and today." - Peter A. Burshre

"Thanks in part to mounting U.S. deficits and a weak U.S. economy, the U.S. dollar continues to trend lower. After all, a virtual collapse of the banking sector does have its consequences. For some perspective, today's chart illustrates the current trend in the US dollar (blue line) as well as that other world currency, gold (gray line).

As today's chart illustrates, the performance of the U.S. dollar has varied inversely to that of gold since the latter stages of the credit bubble. It is worth noting that the U.S. dollar is currently testing resistance of its downtrend (red line) while gold makes record highs."

http://www.chartoftheday.com/20091125.htm?A

Gold Standard Price of Gold = $7,648 an Ounce! - WSJ.com

In January 1980 gold bullion posted its inflation-adjusted record high at $2,290.

If the U.S. dollar were back on the gold standard, notes Société Générale analyst Dylan Grice, then gold would have to be priced at $7,648 an ounce in order to fully back all of the dollars in circulation. 

That calculation is based on the U.S. monetary base of nearly $2 trillion and U.S. government gold holdings of 261.5 million ounces.

"You are basically short trust in government when you buy gold," says Mr. Grice, who suggests gold may be in the early stages of a long-lasting speculative mania. "Gold goes higher until policy makers get ahead of their problems."

WSJ.com - Ahead of The Tape - Mark Gongloff - November 20, 2009

JGH: Obviously, this doesn't mean that gold is going to make a run at $7,000 an ounce any time soon. But it does mean that gold has plenty of room to move higher and is not necessarily overvalued at over $1,150 an ounce.

Health Care Reform Update:

According to the Americans for Tax Reform, the Senate's 2,047-page  health care bill uses the word "tax" no fewer than 183 times, taxable 164 times, "taxes" 17 times, "fee" 152 times and "penalty" 115 times.

And this is heath care "reform" that's supposed to lower costs? How? By taxing the health care consumer to death?

Doesn't it strain credulity to believe that Congress is going to give 30 million additional people health coverage, cut the deficit, improve health care quality, increase access and reduce costs with government taxes, fees, penalties and mandates?

Sunday, November 22, 2009

Ominous Divergence Implies Caution


Charts courtesy www.StockCharts.com

The Dow Jones Industrials ($INDU), a proxy for blue chip stocks, closed at a new weekly cycle high (10,318) on Friday, November 20.

The Russell 2000, a proxy for the small-cap sector, posted a weekly close at 585, which was -5.1% below its Friday, October 16, 2009, close at 616.

That's not what we like to see. If blue chips are making new highs and small cap stocks are not, it creates a negative divergencea non-confirmation that typically signals an end to an intermediate-term rally.

The healthiest stock market rallies occur when all of the major sectors and indices capture new highs in concert. When they don't, it typically signals that stocks will correct and/or begin moving in a sideways range.

And the most profitable and least risky rallies occur when small-cap stocks lead. That's because small-caps are considered the riskiest of the three capitalizations (large-cap, mid-cap and small-cap). And when investors are willing to bid small-cap stocks to new cycle highs, they are confident that the stock market and the economy are healthy enough to support one of the riskiest areas of the stock market. 

Other key sectors that DID NOT confirm the weekly new cycle high on Friday include the bank, brokerage, financial and semiconductor stocks.

Until these sectors and the smallcaps post new cycle highs along with the Dow Jones Industrials, the odds are high that the stock market will undergo a correction.


Friday, November 20, 2009

Top 5 Questions Regarding Health Care "Reform"

This weekend the U.S. Senate will vote on a 2,076 page monstrosity of a healthcare reform bill, which raises some questions:

1. Has any Senator had time to read this bill, which was drafted Pulitburo style, behind closed doors, out of sight of the American people and not posted for all to see?

2. How can gutting $490 billion out of Medicare over the next 10 years "make it stronger?"

3. How can insuring millions more without increasing the number doctors reduce costs, improve quality and increase access?

4. If healthcare is in such a crisis, why is Congress waiting four years for the "reforms" to take effect?

5. Is there any Constitutional authority for Congress to force (by fine and/or imprisonment) U.S. citizens to buy something they don't want?

Bonus Questions:

6. If this "reform" is so exceptional, why is Congress exempting itself from participation in its grand plan for the rest of us?

7. Doesn't Congress's refusal to participate in its own healthcare reforms tell us everything we need to know about the quality of the healthcare we expect from this reform?


Thursday, November 19, 2009

Home Starts Tumble and Mortgage Delinquencies Rise - WSJ.com


The Wall Street Journal reports the following today on page 1...

Overall, about 12.4% of American households with mortgages in October were 30 days or more overdue or in the foreclosure process, according to LPS. That's up from 12.3% in September and 8.6% in October 2008. In the latest month, about 6.9 million households fell into this category.

Meanwhile, more Americans who bought homes during the boom are falling into mortgage limbo. About 3.4% of U.S. households -- or about 1.9 million homeowners -- are 120 days or more overdue on their payments, but not yet in foreclosure, according to LPS Applied Analytics, a research firm in Denver. That is up from 1.5% a year earlier.

By JAMES R. HAGERTY and SARA MURRAY @ WSJ.com
http://online.wsj.com/article/SB125854971533953543.html


Wednesday, November 18, 2009

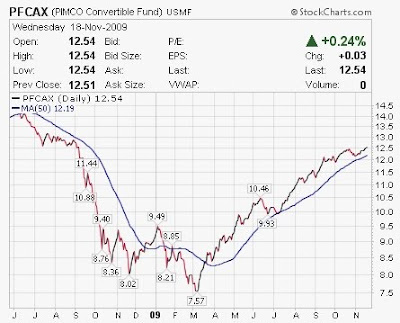
Pimco Convertible: A Viable Substitute for Vanguard Convertible


Chart courtesy of www.StockCharts.com

In mid-June 2009, Vanguard closed Vanguard Convertible Securities Fund (VCVSX) to new accounts and placed an investment limit on current retail accounts.

Vanguard investors seeking a viable alternative can find a suitable substitute in the Pimco Convertible Fund (PFCAX).

For active investors, I've found that selling the fund when it closes below its 50-day moving average (the blue line on the chart) at the end of the week (Friday close) and  buying it when it closes above its 50-day moving average at the end of any week has kept us out of harm's way and has provided above-average returns relative to buying-and-holding the S&P 500.

This way we only have to check on the status of the fund over the weekend and don't have to monitor it every day of the week.

This year PFCAX is up +39.49% versus a +36.1% return for VCVSX (thru 11/18/09).

Since PFCAX closed above it 50-day moving average on Friday May 15, Pimco Convertible is up +33.4% versus only +25.7% for the S&P 500 and +20.6% for Vanguard Convertible.

FULL DISCLOSURE: We currently hold this fund in many of our managed accounts.

And, of course, past performance is no guarantee of future results.

Tuesday, November 17, 2009

Ned Davis Research: The Cyclical Bull Rally is Not Over...

“A strong tape, corporate yields still falling, sentiment not showing extreme optimism, and low inflation are a pretty bullish signal,” Ned Davis says, adding that “at this point in time we don’t have any evidence that the cyclical bull market is over.”

The excerpt above is from an article published at AdvisorPerspectives.com by Robert Huebscher, which summarizes Ned Davis's current market outlook.

Read the full article by clicking on the link below...

Ned_Davis-The_Cyclical_Bull_Rally_is_Not_Over.php

Monday, November 16, 2009

Foreign Equities or U.S. Equities: How to Make the Allocation Decision


Charts courtesy of www.StockCharts.com

The EAFE iShares ETF (EFA) is our proxy for foreign equities. It covers Europe, Australia, the Far East, but not the emerging markets or any U.S. based companies.

The SPY ETF tracks the S&P 500 (S&P 500 SPDR).
  • In other words, for every $1.00 in foreign equity funds, hold $2.00 in U.S. equity funds
When the RED line trades ABOVE the BLUE line, we are BULLISH on foreign equity mutual funds (EFA) and recommend a 2-to-1 ratio allocation of foreign funds relative to U.S. (domestic) equity funds. 
  • In other words, for every $1.00 in U.S. equity funds, hold $2.00 in foreign equity funds.

When the RED line trades BELOW the BLUE line, we are BULLISH on U.S. equity mutual funds (SPY) and recommend a 2-to-1 ratio allocation of  U.S. (domestic) equity funds relative to foreign  foreign equity funds.

The RED line has traded ABOVE the BLUE line since May 15, 2009. Therefore, we favor EFA over SPY by a 2-to-1 margin until the relationship reverses. Since May 15EFA is up +31.6% versus a +24.9% gain for SPY, a +6.7% outperformance difference in only six months.

Sunday, November 15, 2009

Gold Bullion ETF & TIP ETF Are Moving in Concert


Chart courtesy of www.StockCharts.com

Because inflation expectations are rising, gold bullion, as depicted by the streetTRACKS Gold Trust Shares (GLD), is trending higher to new alltime highs. That's typical in a weak dollar climate. Unfortunately, GLD is highly volatile and it doesn't pay any interest.

The good news for conservative investors is that because Treasury Inflation Protected Securities (TIPs) are rising in tandem with gold bullion (see chart), TIPs offer a more conservative hedge against inflation combined with the bonus of a dividend payment (which is quite low at present) attached.

The most popular TIP ETF is the iShares Barclays TIPS Bond Fund, symbol TIP.


Friday, November 13, 2009

Similarities and Differences Between 1983 and 2009 @ WSJ.com


The table herein was showcased in the November 10, 2009, issue of the Wall Street Journal's "Ahead of the Street" column, which makes a rather discouraging
comparison between the market and economic climates that prevailed in 1983 and 2009. Both years were notable for deep recessions and extreme volatility.

Despite the fact that the unemployment rate is the same at 10.2%, the two stats that stand out in bold relief are that...

(
1) the S&P 500's P/E ratio is twice as high (18.9) now as it was in 1983 (9.5)and

(2) In 1983 household debt as a percentage of disposable income was only 62% versus 122% today, nearly twice as high.

High P/E ratios tend to put a cap on the upside potential of  stock market rally.

High household debt threatens to dampen consumer spending and impair the convalescence of a crippled housing market that is currently on life support.


Thursday, November 12, 2009

How the U.S. Dollar Has Plunged vs Foreign Currencies (FX) in the Past 10 Years


Back in 1999…

An average house cost $129,000. Now it’s $180,000 (+40% increase)...and that’s after the real estate market crashed. 

 
A gallon of gas was $1.15 and now it’s over double that (actually +143% higher) at $2.80!

A loaf of bread was $1.26 and now it’s $2.39 (+90% higher).

A dozen eggs cost 88 cents, now $1.49 (+69% higher).

A postage stamp was 32 cents and now its 44 cents (+38% higher).

What can we thank for the higher prices over the last decade? As strange as it sounds in the current deflationary environment, inflation stole your dollar’s value over the last 10 years.

The Dollar’s Purchasing Has Lost 21% of Its Purchasing Power During This Decade

The reality is that the costs of EVERYTHING you touch are going up astronomically and the dollars in your bank account buy less and less all the time.

What’s worse is that while the costs of goods are on the rise again…unemployment is hitting its highest levels in 26 years. That means that companies can’t raise salaries to keep up with the ever-rising cost of living.


Wednesday, November 11, 2009

The High-Yield Bond / Treasury Bond Ratio: A Barometer of Economic Health


Charts courtesy of www.StockCharts.com

When the RED line trades ABOVE the BLUE line, we are BULLISH on High-Yield Bonds and the U.S. economy.

  • We SELL Treasury Bonds and BUY High-Yield Bonds.

When the RED line trades BELOW the BLUE  line, we are BEARISH on High-Yield Bonds and the U.S. economy, and we are BULLISH on Treasury Bonds.
  • We BUY Treasury Bonds and SELL High-Yield Bonds.

Note that The High-Yield Bond / Treasury Bond Ratio forewarned of an economic contraction in the summer of 2007, ahead of the worst recession since the Great Depression of the 1930s (the RED line traded BELOW the BLUE line). 

And it didn't turn up until the coast was clear for the U.S. economy and the U.S. stock market in the late spring of 2009.

Tuesday, November 10, 2009

U.S. Dollar Losing It's Luster to Gold Bullion


"There is no subtler, no surer means of overturning the existing basis of society than to debauch the currency."  -John Maynard Keynes

In the last four decades, the U.S. Dollar has lost a whopping -92% of its purchasing power. And it has lost -21% of that purchasing power in just the last nine years.

Barclays Bank has recalculated the dollar's share of global currency reserves. The dollar once stood at 80% of global reserves. Back in 2002, before the weak dollar trend, the dollar made up 73% of global reserves. Now that has fallen to 62.8%.

Central banks are diversifying away from the Dollar and paper fiat currencies in general. Instead they're exchanging paper currencies for gold. And that's why gold is trading at over $1,100 an ounce.


Charts courtesy of www.StockCharts.com

Stock / Bond Ratio Protects Your A$$ets from Bear Markets!

The following will give you a historical and visual perspective of why, at the end of November 2007, we SOLD Stocks and BOUGHT Bonds.
In the chart below we compare the performance of Stocks versus Bonds


Charts courtesy of www.StockCharts.com

After the RED line crosses ABOVE the BLUE line, we become BULLISH on Stocks. We SELL Bonds and BUY Stocks.

After the RED line crosses BELOW the BLUE line, we become BEARISH on Stocks. We SELL Stocks and BUY Bonds.

1. SELL Stocks and BUY Bonds...

From November 30, 2007 to June 30, 2009, the RED line trades below the BLUE line and the S&P drops from 1481 to 919, a gut-wrenching -37.9% plunge and an ENTIRE bear market is AVOIDED!


2. SELL Bonds and BUY Stocks...

From June 30, 2009, to October 30, 2009, the RED line trades above the BLUE line and the S&P jumps from 919 to 1036, a rally of +12.7%.  

Buy-&-Hold-&-Hope S&P 500 investors are still down -30% from November 30, 2007, through October 30, 2009.

This long-term trend indicator has repeatedly done an exceptional job of filtering out all the noise and keeping us on the right side of the market.


Monday, November 9, 2009

Status of Our Vantage Point Investment Models

As of the close on Friday, November 6, the status of our Vantage Point Models is as follows:

Our Intermediate-Term Stock Model is NEGATIVE as of May 16, 2008.
Our SmallCap Momentum Model is NEGATIVE as of January 4, 2008.

Our Treasury Bond Model is NEGATIVE as of February 20, 2009.
Our High-Yield Bond Model is POSITIVE as of July 24, 2009.

In our relative strength work, we favor:
  • SmallCap funds over LargeCap funds   (since 07/24/09)
  • Growth funds over Value funds           (since 07/24/09)
  • Foreign funds over U.S. funds             (since 02/29/09)
  • LargeCap Growth funds over SmallCap Value funds (since 03/07/08)

Sunday, November 8, 2009

IBD 100 Stocks - Breakaway Gaps to New Highs on Big Volume


Click on the link below to view the seven IBD 100 (Investor Business Daily) stocks that gapped up to new highs on above average volume last week...


Charts courtesy of StockCharts.com

Of the seven, the IBD 100 stocks with most promise are MELI, DGIT, MSTI, and, to a lesser extent, SLH because of the enormous volume and  magnitude of the breakaway gaps.

Typically IBD 100 stocks that exhibit this degree of momentum and volume outperforming the broad market going forward.

However, risk management is vital when buying IBD 100 stocks that meet the Breakaway- Gap-to-New-Highs-on-Big-Volume criteria.

Caveats:
Don't invest in this method unless you are willing to set your stop loss at any close below the stock's 20-day moving average (the blue moving average line on the charts). You must risk no more than 2% of your account size on any single trade, so size your position accordingly.

My experience in back-testing and real world trading of IBD 100 stocks that meet this criteria is that roughly 3 out 4 trades are profitable, with winners outpacing losers by an enormous margin.

As a safety-first filter, however, don't buy any stocks (whatsoever, for any reason!) when the S&P 500 is below its 200-day moving average.

Unemployment rate above 10% for only the 2nd time since WWII


Chart of the Day - courtesy of www.chartoftheday.com

On Friday November 6, 2009, the Labor Department reported that the unemployment rate increased to 10.2% -- a 26-year high. For some perspective on the current state of the labor market, today's chart illustrates the unemployment rate since 1948. As today's chart illustrates, today's move above the 10% threshold marks only the second time such a move has occurred during the post-World War II era. It is also worth noting that the unemployment rate has tended to peak shortly after the end of the recession. Following the previous two recessions, however, the unemployment rate kept rising for many months following the beginning of an economic "expansion."


Notes:
- Where's the market headed? The answer may surprise you. Find out right now with the exclusive & Barron's recommended charts of Chart of the Day Plus.


Chart of the Day - Unemployment rate above 10% for only the second time since WWII