Wednesday, June 30, 2010

Retirement Income for Boomers: No More Than A Guessing Game?


More than 90% of Baby Boomers feel the United States is facing a retirement crisis, yet most have a limited understanding of how much money they’ll need and fear they’ll outlive their income according to a new survey from Allianz Life Insurance Company of North America (Allianz Life). 

The study, titled Reclaiming the Future: Challenging Retirement Income Perceptions, was conducted in May 2010 with more than 3,200 Baby Boomers ranging in age from 44 to 75.

Although 61% of Boomers fear outliving their money in retirement more than death, 31% say they are not too clear about what their expenses will be in retirement and 36% have no idea if their income will last.

“These results are troubling not only because people are fearful about retirement income, but also because of how little they know about how much money they’ll need,” said Gary C. Bhojwani, president and CEO of Allianz Life. “We hope that our Reclaiming the Future study will shed some light on the issue and inspire Boomers to take control of their retirement planning today.”

A majority of respondents feel their retirement lifestyle must surpass their parents (79%), indicating a need to focus on income in retirement versus accumulation of assets.

When asked how much yearly income is needed in retirement, respondents indicated a median income of $59,000 per year. 

Unfortunately, Boomers were off by a factor of nearly 3 times too small when estimating how much they’d need to save to create that household income.

It’s clear that this level of planning amounts to no more than a guessing game.


Tuesday, June 29, 2010

Unemployment for Seniors? Still Rising...


Monday, June 28, 2010

Post-Massive Bear Market Rallies: Historical vs.The Present


Today's chart illustrates rallies that followed massive bear markets. For today's chart, a 'massive' bear market is defined as a decline of greater than -50%.

Since the Dow's inception in 1896, there have been only three bear markets whereby the Dow declined more than -50% (early 1930s, late 1930s until early 1940s, and during the very recent financial crisis).

Today's chart also adds the rally that followed the dot-com bust during which the Nasdaq declined -78%. The current Dow rally has followed a path that is fairly similar to that of the Nasdaq rally that began in late 2002 as well as the Dow rally that began in 1942.

It is worth noting that after 300 (plus or minus) trading days the market moved into a trading range/choppy phase that lasted for a year or more.


Saturday, June 26, 2010

Vantage Point UPDATE: Intermediate-Term and Long-Term Trend Analysis


On
Friday June 25th the S&P 500 closed @ 1077, and that was...
  
   -0.7% BELOW its 12-Month moving average which stood @ 1084.
   -3.0% BELOW its 40-Week moving average which stood @ 1110.
   -3.7% BELOW its 10-Week moving average which stood @ 1118.


Therefore, the INTERMEDIATE-Term trend IS BEARISH and the LONG-Term trend is NEUTRAL.

Friday, June 25, 2010

An Intractable Fiscal Problem - by David Rosenberg (The Massive, Snowballing Debt Bulge)


An Intractable Fiscal Problem
by David Rosenberg


Even with low interest rates, the massive debt bulge has become so large that interest charges on the public debt are within 3 years of absorbing over 30% of the revenue base, which then makes it that much tougher to reverse course. 

In other words, the fiscal problem is becoming increasingly structural and we are already at the stage where even if the economy were running flat out at full employment, the deficit would still be over 7% relative to GDP. At some point, this will begin to impede economic progress.

When you add up the entitlement programs, you know — the ones you can’t cut back on, and interest payments on the grotesque debt load, we have 65% of total government spending that can’t be touched. 

In the next decade, under status quo policies, this “mandatory” share of the spending pie goes to 72%. Tack on the defense budget, my friends, and we are up to 88% of federal government outlays that are next to impossible to reverse. 

So tell me — we are going to reverse this seemingly intractable run up in the public debt to GDP ratio by slicing 12% of the spending pie that is discretionary? It won’t be enough, even if all that 12% remainder ‘pork and barrel’ spending were eliminated altogether.

So guess what the future holds … higher taxes: very likely a national sales tax. It works in Europe. It has also worked in Canada. Japan is planning to double its national sales tax from 5% to deal with its fiscal challenge. 

It stands to reason that a federal consumption tax will have to be part and parcel of any U.S. strategy to solve what is increasingly becoming an intractable budgetary deficit.


Indeed, while many a Keynesian will point to the need for a government-led demand boost, the problem is that when the deficits and debts become structural, what is known as the “Ricardian Equivalence” sets in and this means that the fiscal stimulus does more harm than good for the economy.

Unfortunately, while the bailouts saved insolvent banks (oh, we’re not Japan at all) the stimulus from this Administration involved a series of short-term quick fixes that provided no long-term multiplier impact. At least FDR put people to work — not merely to pay them to be idle. At least Eisenhower built highways -- with a long-run payback.

Read the entire article here...


Thursday, June 24, 2010

The Value Added Tax (VAT)...Is It Coming to America?

The "Value Added Tax."  

In its simplest form, a VAT is a tax on the creation of value. At each stage of producing a product, from raw materials to fabrication, to assembly, to packing and shipping, each company is responsible for paying a tax on the value it adds.

As the VAT is always included in the retail prices, and consumers never have to pay more at the cash register,
the tax increase would be hidden. In fact, consumers would no longer see a sales tax at the cash register. While that stealth will make a VAT seem "painless" to many, it is also what makes it so dangerous.

Most European countries introduced the VAT at rates around 10% and quickly raised it to the upper teens. Today most European countries have rates around 20% (the only notable exception is Luxembourg at 15%).

 
Country
Year Introduced
Initial Rate
Current Rate
Denmark
1967
10%
25%
Germany
1968
10%
19%
Spain
1986
12%
18%
France
1954
18%
20%
Ireland
1972
16%
21%
Italy
1973
12%
20%
Luxemburg
1970
8%
15%
Netherlands
1969
12%
19%
Sweden
1969
11%
25%
UK
1973
10%
18%


VAT rates have commonly been increased with hardly a whisper from the media. And they don't always go up in incremental single percentage points. Many European countries have raised rates 3% or 4% in one single year. In the case of
Estonia, in 1993, rates increased by +8%.


Wednesday, June 23, 2010

Brand-Name Drug Costs Burden Seniors

  • +9.7% - Average annual increase in brand name drug manufacturer prices between April 2009 and March 2010.

  • $6,580 – Average annual cost to someone taking 3 brand name drugs in the same time period.

  • +10% - Average annual manufacturer price increase for brand name drugs with no generic equivalent.

  • 82 – Number of drugs out of 219 in the brand name market that are off-patent.

  • 88% - Percentage of brand name drugs that had a price increase between April 2009 and March 2010.

  • $2,760 – Increase in cost of therapy for someone taking one medication to treat a chronic condition in 2010.

  • -9.7% - Average decrease in price in generic prescriptions used by Medicare beneficiaries.
Source: AARP

Tuesday, June 22, 2010

1 of 5 Senior Americans Has Been Swindled

More than 7.3 million older Americans — 1 out of 5 citizens over the age of 65 — already have been victimized by a financial swindle, according to a new survey.

The survey, by the nonprofit Investor Protection Trust and conducted by Infogroup/ORC, was released Tuesday to mark World Elder Abuse Awareness Day.

The survey of 2,022 American adults — including 706 adult children with at least one parent aged 65 or older and 590 adults who are aged 65 or older and have children — found that half of older Americans exhibit one or more of the warning signs of current financial victimization.


For example, more than one out of three seniors (37%) are currently being pitched by “people [who] are calling me or mailing me asking for money, lotteries, and other schemes.” 


Almost half of those aged 65 or over (44%) got at least 2 out of 4 questions wrong about basic investment knowledge. About 1 out of 3 older Americans (31%) said they are vulnerable in one or more ways to potential financial victimization.


“We now know that a shockingly large number of older Americans are already victims of financial swindles and millions more are in danger of being exploited in such a fashion,”
said IPT president and CEO Don Blandin in a statement.

71%
of those over 65 handle their finances themselves, while 24% rely on relatives for at least some help and 3% rely on non-family members, according to their children.


89%
of children are “very confident” or “somewhat confident” of their parents' current ability to handle personal finances. Only 11% of them said they are “not very confident” or “not confident” at all. 


Monday, June 21, 2010

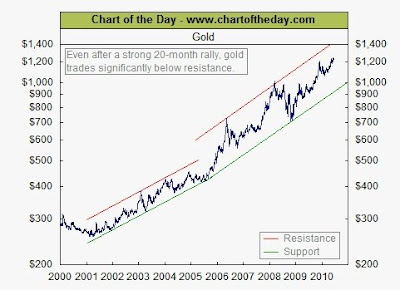
Chart of the Day - Gold Bull Market Persists


Chart & Analysis Courtesy of Chart of The Day

Today's chart provides some long-term perspective in regards to the gold market.
 
As today's chart illustrates, gold has been in a strong bull market since 2001.

The pace of that upward trend increased beginning in mid-2005. Following the financial crisis of late 2008, gold surged once again.

While gold made another record high in June, it still trades significantly below resistance (dark red line) of its upward sloping trend channel.

In the end, with Gold currently trading near $1,250 per ounce, Gold has more than quadrupled in price during its nine-year bull market.


Saturday, June 19, 2010

Vantage Point UPDATE: Intermediate-Term and Long-Term Trend Analysis


On
Friday June 18th the S&P 500 closed @ 1118, and that was...
  
   +2.5% ABOVE its 12-Month moving average which stood @ 1090.
   +0.7% ABOVE its 40-Week moving average which stood @ 1110.
   -1.0% BELOW its 10-Week moving average which stood @ 1129.


Therefore, the INTERMEDIATE-Term trend IS NEUTRAL and the LONG-Term trend is NEUTRAL.

Friday, June 18, 2010

10 Estate Planning Success Tips

10 Estate Planning Success Tips


While our representatives continue to talk about the repeal of estate taxes, there is still a federal estate tax in effect. The threshold for imposing this tax was raised to $1 million per person for people dying in 2003, and the estate tax is scheduled to disappear for only one year - 2010. In 2011, the estate tax is scheduled to reappear, so continue to take the following recommended actions in protecting your assets!


  1. Keep your will or trust up to date. Many state laws invalidate any will made prior to a major life event, such as marriage, divorce, moving to a new state, or the birth or adoption of a child. Keep your legal residence address, marriage status, beneficiaries list, etc. updated.

  2. Keep track of beneficiaries for all of your IRAs, qualified plans and insurance policies. Do you know who your beneficiaries are for these assets? If you don’t, they may be going to someone you no longer wish to receive them. You can easily change the name of the person who will receive their benefits by filling out a form.

  3. Maximize the liquidity of your estate. Liquidity is defined as the ability to quickly turn assets into cash. Without sufficient cash to pay taxes, funeral, and other expenses, your family may have to sell illiquid assets - such as a family business or other property - at an inopportune time. Avoid putting your family in the position of selling off the estate in a hurry by providing for sufficient liquidity.

  4. Maintain an Appropriate Mix of Investment Risk. It’s detrimental to have too much money allocated to risk in stocks or mutual funds, as a percentage of total cash assets and age. Over time, more risky investments should be moved into safe and stable investments such as Annuities.

  5. Name a dependable executor and/or trustee. Executors are called upon to collect assets, pay obligations, and distribute your assets. Your trustee must enforce all the provisions of any trusts you created. Choose people who have the knowledge, integrity and stamina in the face of pressure from family members to fulfill these obligations.

  6. Explore the ramifications of joint asset ownership with your spouse. This ties in with the estate tax issues in item 1: if your joint net worth exceeds $1 million, you might want to consider owning some assets separately as part of your overall estate plan.

  7. If you have minor children, consider naming one guardian for your minor children and a separate guardian for the property you've left to support them. The best guardian for your children may not be the most effective money manager you know. Just be aware that the person you've chosen as guardian of your children, can be a different person than the guardian that manages your children’s property.

  8. Estate planning for your spouse or other sole survivor scenarios. If your net worth is high enough, your estate may be subject to taxes. A simple estate plan can save some individuals hundreds of thousands of dollars in estate taxes.

  9. Leaving the right assets to the right people. If your child was a "special needs" child, you would not leave him money to handle on his own. Make sure your teenager or other dependents, receive much needed management along with the cash.

  10. Plan, Plan, Plan. The future is in your control. Decisions you make about how you structure your estate will affect your family. Until you’ve taken action, you don’t have an estate plan, but don’t be overwhelmed. Nothing is irreversible, and you can take small steps to put your plan into place. Planning is most important for business owners, who must plan for the succession and/or buy-out of their business. 

Thursday, June 17, 2010

3 Ways To Save On Long-Term Care Insurance

1.  Leverage good health. Insurers will require that you meet certain health qualifications to obtain coverage. Discounts are provided to those in good health and 62% of applicants between ages 40-49 qualified in 2009. The percentage drops to 46% for ages 50-59 and only 38% for ages 60-69.

Once obtained, the preferred health discount is not lost when your health changes.


2.  Right-size coverage. Some long-term care insurance is always better than none. Factor in other sources of income such as Social Security, pension and 401(k) plans that can pay costs and allow you to add money-saving options such as a 90-day deductible (Elimination Period) or consider a limited-pay plan with a Shared Care option that allows two spouses to share a common benefit pool.

 
3.  Compare coverage. Each insurer establishes its own rates, health standards and available discounts. As a result, virtually equal protection from two highly-rated insurers can vary by between 30% and 80%. Ask your insurance professional if they have access to policies from just one or from multiple insurers.

Wednesday, June 16, 2010

Are We 10 years Into A 16-Year Secular Bear Market?


Last week, the Dow Jones Industrial Average rose above 10000—again.

Since March 16, 1999, when it first touched 10000 in intraday trading, the Dow has bounced over that threshold and back 63 times.

On Friday, the index closed 220 points below where it stood exactly 11 years ago.

This isn't the first time stocks have been stuck on a seemingly endless pogo-stick ride.

On January 18, 1966, the Dow hit an intraday high of 1000.50. It broke through the 4-digit barrier 3 more times that January and February, then faded. The Dow cracked 1000 again in 1972 and 1976, then fell back both times.


Not until December 1982 did the Dow finally hurdle above 1000 and stay there.

Are we 10 years into a similar 16-year secular bear market?

Jason Zwieg, Wall Street Journal
 
The Intelligent Investor: 11 Years and Counting - WSJ.com

Tuesday, June 15, 2010

Recession Time Frames Over The Long Haul


Today's chart shows all the recessions since 1871 as defined by the National Bureau of Economic Research (NBER).

During those nearly 14 decades, the United States has been in recession 30% of the time.

Fortunately the economic conditions have gradually improved over this time frame:

          1871-1900: Recessions = 48% of the time

          1900-1950: Recessions = 37% of the time

          1950-2010: Recessions = 13% of the time


The latest recession could be the longest since the Great Depression.


Monday, June 14, 2010

Status Of This Market: Bull or Bear?

Ned Davis Research reports that the average bull market since 1900 has produced gains of +81.2% and that the S&P had popped up +79.93% through April 23. Therefore, this bullish phase is long in the tooth. 
According to Bespoke Investment Group, there have been 58 corrections of -10% or more in the Standard & Poor's 500 since 1927.

In 25 cases (43%), corrections that reached the -10% mark went on to become a full-fledged bear market, while 57% stopped short of turning truly ugly.
However, Bespoke also warns us that in the 32 instances when the market has dropped as much as this one (as of June 7th the S&P had pulled back -13.7% on a closing basis and -14.68% on an intraday basis) the corrections have a distinct tendency toward continuing.

According to Bespoke’s research, only 7 corrections of this magnitude stopped short of the bear market definition (generally defined as a decline of -20% or more). 
And in the 25 instances in which the decline reached the -20% mark, the average decline of the bear move was -35.5% from top to bottom.
In light of the above, it's prudent to err on the side of capital preservation until the climate improves.

Saturday, June 12, 2010

Vantage Point UPDATE: Intermediate-Term and Long-Term Trend Analysis


On
Friday June 11th the S&P 500 closed @ 1092, and that was...
  
   +0.5% ABOVE its 12-Month moving average which stood @ 1086.
   -1.5% BELOW its 40-Week moving average which stood @ 1108.
   -4.0% BELOW its 10-Week moving average which stood @ 1137.


Therefore, the INTERMEDIATE-Term trend IS BEARISH and the LONG-Term trend is NOW NEUTRAL.

Thursday, June 10, 2010

U.S. Foreclosures Fall, Bank Repossessions (REOs) Hit Record High

The national foreclosure rate continued to fall in May from the previous month, according to a new report released Thursday.

The national foreclosure rate fell by 3.27% in May from the previous month.

However, bank repossessions reached a record high during the same month, a sign that lenders are focusing on their backlog of foreclosure inventory before tackling new distressed loans, according to foreclosure database website RealtyTrac, which released the report.

“What it looks like is that the lenders are focusing on processing the delinquent loans they already have rather than initiating new foreclosures,” said Rick Sharga, senior vice president of RealtyTrac.

F
oreclosure activity dropped 3.27% in May from the previous month, and was up +0.45% from May 2009. In all, 322,920 properties generated a foreclosure notice.

1 in every 400 homes in America received a foreclosure notice in May. Bank repossessions (known as real estate owned properties or REOs) hit a record high in May for the second month in a row.

All 50 states reported a year-over-year increases in REOs, according to RealtyTrac. It is projected that over 3 million homes will receive a foreclosure notice over the course of this year, said Sharga.


Wednesday, June 9, 2010

Is College Tuition The Next Bubble To Burst?


Tuition has been increasing at double triple the rate of inflation.

"On average, college tuition has increased at around 8% per year, which means the cost of college doubles every nine years. Because colleges know that students will simply borrow more money to cover tuition increases, colleges have been relying on steady tuition hikes to solve all of their money problems. If this continues a college degree will soon cost as much as a house."

Read more here.

Tuesday, June 8, 2010

How Much Does Long-Term Care Insurance Cost Seniors?

20.8% - Percentage of Long-Term Care Insurance (LTCI) policyholders between 61 and 75 who pay less than $1,499 per year for coverage.

73.6% - Percentage of LTCI policyholders between 61 and 75 who pay $1,500 or more for coverage.

78.5% - Percentage of LTCI policyholders over 76 who pay $1,500 or more for coverage.

22.1% - Percentage of LTCI policyholders over 76 who pay less than $1,499 per year for coverage.

Source: American Association for Long-Term Care Insurance