Tuesday, November 30, 2010
Monday, November 29, 2010
Vantage Point UPDATE: Intermediate-Term and Long-Term Trend Analysis
On Friday November 26 the S&P 500 closed @ 1189, and that was...
+6.7% ABOVE its 12-Month moving average which stood @ 1101.
+5.0% ABOVE its 40-Week moving average which stood @ 1121.
+0.6% ABOVE its 10-Week moving average which stood @ 1141.
Therefore, the INTERMEDIATE-Term trend IS MODERATELY BULLISH and the LONG-Term trend is BULLISH.
Friday, November 26, 2010
Nursing Home, Assisted Living Rates Continue To Rise...
According to the Metlife Market Survey of Long-Term Care Costs, nursing home and assisted living rates have been on a steady incline since 2009.
There has been a +4.6% increase in private room nursing home rates, raising to $229 per day or $83,585 per year, with the highest average daily rates in Alaska, where rates are now $687 for a private room and $610 for a semi-private room. Costs are lowest in Louisiana, outside the Baton Rouge and Shreveport areas, at an average of $138 per day for a private room.
Assisted living rates rose +5.2% on average to $3,293 per month or $39,516 per year. The Washington, D.C., area had the highest average monthly base rate at $5,231 for assisted living while Arkansas, outside of Little Rock, had the lowest average monthly rate of $2,073.
68% of nursing home residents were women, and only 16% of all residents were under the age of 65, according to the 2009 Census. The median age of residents was 83 years.
The American Association of Homes and Services for the Aging estimates nearly 1 million people live in approximately 39,500 assisted living residences in the U.S.
The average age of an assisted living resident is 86.9 years old, and the median length of stay in assisted living is 29.3 months.
The average age of an assisted living resident is 86.9 years old, and the median length of stay in assisted living is 29.3 months.
Adult day services centers are seeing more growth as a cost-effective provider of long-term care services. There has been a +35% increase since 2002 in adult day service centers nationwide with a total of 4,600 currently. Rates have stayed the same, however, remaining at about $67 per day.
Sandra Timmermann, Ed.D., director of the MetLife Mature Market Institute, says the increase in nursing homes and assisted living rates even outpaces medical care inflation by about +3%.
She adds as more people need long-term care, now is a good time for “individuals and families to look into savings plans, annuities and long-term care insurance to hedge the possibilities.”
She adds as more people need long-term care, now is a good time for “individuals and families to look into savings plans, annuities and long-term care insurance to hedge the possibilities.”
Source: MetLife Mature Market Institute®
Wednesday, November 24, 2010
What It Takes to Rank in the Top 2% of Wage Earners...
To rank in the Top 2% of taxpayers (based upon 2008 tax data) required an adjusted gross income (AGI) level of $253,000.
To rank in the Top 3% of taxpayers required an AGI of $204,000.
To rank in the Top 4% of taxpayers required an AGI of $177,000.
Source: Internal Revenue Service
Tuesday, November 23, 2010
Monday, November 22, 2010
Vantage Point UPDATE: Intermediate-Term and Long-Term Trend Analysis
On Friday November 19 the S&P 500 closed @ 1200, and that was...
+7.5% ABOVE its 12-Month moving average which stood @ 1116.
+6.1% ABOVE its 40-Week moving average which stood @ 1131.
+2.1% ABOVE its 10-Week moving average which stood @ 1175.
Therefore, the INTERMEDIATE-Term trend IS MODERATELY BULLISH and the LONG-Term trend is BULLISH.
Friday, November 19, 2010
Thursday, November 18, 2010
Extrapolating A Private College Education for A Child Born in 2010...
A child born in 2010 that begins kindergarten in the fall of 2015 would attend college between the years of 2028 and 2032.
If that child attended an average private 4-year college and if the annual price increases for private colleges experienced over the last 30 years continued into the future, the total 4-year cost of the child's college education (including tuition, fees, room & board) will total $506,423 or nearly $127,000 per year.
Source: College Board
Wednesday, November 17, 2010
Americans Clueless About Long-Term Care Giving Realities...
An estimated 66 million Americans serve as unpaid caregivers for loved ones.
A new study revealed the actual impact of caregiving is often much greater than expected. Here are the highlights from the study:
While only 40% of caregivers expect they will contribute financially to the care of a family member, the reality is 83% end up doing so.
Only 38% of caregivers expect to experience a decrease in income while actually 63% of caregivers do experience a decrease.
37% of caregivers expect their savings to decline as a result of caregiving while the study found, in fact, 61% of caregivers used some of their savings to care for a loved one.
57% of caregivers actually dipped into their retirement funds to help care for a loved one, compared to only 34% who expected having to do so.
48% of caregivers suffered employment stresses, including losing a job, changing shifts or missing career opportunities as a result of caregiving responsibilities, compared to only 29% who expected such impact.
Only 35% of Americans believe they will ever need long-term care.
But the reality is 70% of people older than 65 will need long-term care at some point during their lives.
Source: Genworth Financial
Tuesday, November 16, 2010
Monday, November 15, 2010
Vantage Point UPDATE: Intermediate-Term and Long-Term Trend Analysis
On Friday November 12 the S&P 500 closed @ 1199, and that was...
+7.5% ABOVE its 12-Month moving average which stood @ 1116.
+6.3% ABOVE its 40-Week moving average which stood @ 1128.
+2.8% ABOVE its 10-Week moving average which stood @ 1166.
Therefore, the INTERMEDIATE-Term trend IS MODERATELY BULLISH and the LONG-Term trend is BULLISH.
Friday, November 12, 2010
U.S. Education By The Numbers...
7,000 students drop out of high school every school day, for a total of about 1.3 million students a year.
12% of U.S. public high schools (about 2,000 schools) produce nearly half of the nation's dropouts and 58% of African-American dropouts.
50% of incoming ninth graders in urban, high-poverty schools read 3 or more years below grade level.
39% of high school students reported spending one hour or less a week reading or studying for class in 2009.
23% of new American teachers come from the top third of their graduating class.
14% of new American teachers in high-poverty schools come from the top third of their college class.
100% of teachers in Singapore, South Korea and Finland come from the top third of their college class.
Sources: Alliance for Excellent Education, High School Survey of Student Engagement, McKinsey & Co.
Thursday, November 11, 2010

Wednesday, November 10, 2010
Tuesday, November 9, 2010
Chart of The Day - Current Rally Remains Below Average
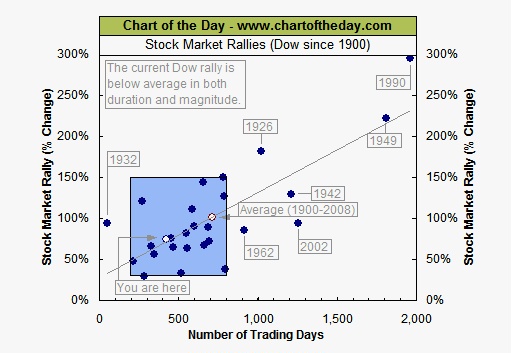
Each dot represents a major stock market rally as measured by the Dow.
As today's chart illustrates, the Dow has begun a major rally 27 times over the past 110 years which equates to an average of 1 rally every 4 years.
Also, most major rallies (73%) resulted in a gain of between +30% and +150% and lasted between 200 and 800 trading days -- highlighted in today's chart with a light blue shaded box.
As it stands right now, the current Dow rally (hollow blue dot labeled you are here) is still somewhat short in duration and below average in magnitude when compared to all the stock market rallies that occurred since 1900.
It is worth noting, however, that the current rally is in line with the more typical rallies (see light blue shaded box) of the past 110 years.
Chart & Commentary Courtesy of Chart of the Day
Monday, November 8, 2010
Vantage Point UPDATE: Intermediate-Term and Long-Term Trend Analysis
On Friday November 5th the S&P 500 closed @ 1226, and that was...
+9.5% ABOVE its 12-Month moving average which stood @ 1120.
+9.0% ABOVE its 40-Week moving average which stood @ 1125.
+6.0% ABOVE its 10-Week moving average which stood @ 1157.
Therefore, the INTERMEDIATE-Term trend IS BULLISH and the LONG-Term trend is BULLISH.
Friday, November 5, 2010
The Misguided Promise of 529 Plans...
by Robert Huebscher
Paying for college is one of the most important responsibilities parents have to their children. When Congress passed legislation creating 529 savings plans in 1996, it took an important step toward making that task easier.
It hasn’t worked out that way, though. Along with the overall market, 529 plans – specifically, the funds in which they were invested – suffered disastrous returns in 2008, leaving many families with insufficient funds to pay their tuition costs.
The real problem, though, is not with the past performance of 529s.
A misguided promise underlies the vast majority of 529 plans – that their heavy allocation to equities will provide acceptable risk-adjusted returns for the time horizons over which most parents invest.
Read more here....
The Misguided Promise of 529 Plans
Thursday, November 4, 2010
Home Price & Foreclosure Outlook Remains Bleak...
Home prices continue to fall because sales aren't taking off. Without buyers, the market can't bottom out.
New home sales continue to languish around historic lows, barely exceeding an annual rate of 307,000. Existing home sales did rise to a 4.53 million annualized rate in September, up +10% compared with a month earlier, but are still well below the boom years.
Of course, nobody is buying homes when they can't find jobs. And still more people can't hang on to their homes because they're out of work.
Nearly 1 million homes are expected to be repossessed this year, and analysts seem to be competing to issue the most dire forecast for future foreclosure numbers.
- Morgan Stanley reported that about 3.1 million borrowers are seriously delinquent with many expected to lose their homes.
- Mark Zandi, chief economist with Moody's Analytics, says more than 4 million homes are in trouble with half of those expected to go to foreclosure.
- And Laurie Goodman, of Amherst Securities, estimates the number of homes in danger of foreclosure at a whopping 11 million!
- Real estate analyst Kyle Lundstedt, of LPS Applied Analytics, said serious delinquencies will continue to spike and will not return even to the current rates -- which are already at peak levels -- until late 2012 or early 2013.
Wednesday, November 3, 2010
Seasonal Tendencies - Historical Backdrop Favorable...
Historically, the best 6-month period to invest in stocks is from November through the end of April.
By contrast, from May through October period the Dow Industrials have seen average gains of just +0.4%.
Therefore, remarkably enough, 94.8% of all stock market gains since 1950 have come during the November through April period.
Historically, we are in a very favorable seasonal period for stocks for three reasons:
First, November 1st is here and the best 6-month period of the year is about to begin.
Second, we're in the sweet spot of the Presidential Cycle, a period in which stocks have enjoyed above-average returns with below-average risk.
Third, stocks are also entering the most favorable 3-month historical span—the period from November 1 through January 31.
Second, we're in the sweet spot of the Presidential Cycle, a period in which stocks have enjoyed above-average returns with below-average risk.
Third, stocks are also entering the most favorable 3-month historical span—the period from November 1 through January 31.
Over the past 60 years the S&P has gained roughly +5.0% during this 3-month period—a +21.5% annual rate.
While it is truly remarkably how consistent these 3-month and 6-month tendencies have been over the past 60 years, remember that these are long-term seasonal tendencies, not certainties for any given year.
Seasonal tendencies are strongest when the economic fundamentals are healthy, much as they are right now. At present stocks don’t have to contend with exorbitant valuations, runaway inflation or a hostile Fed.
Tuesday, November 2, 2010
Historically, Mid-Term Elections Are Very Bullish for Stocks...
“In the 17 midterm elections since 1942, the stock market over the next 200 days has gone up 100% of the time, with an average gain of +18.3%.”
Steve Leuthold, The Leuthold Group, Chief Investment Officer
Monday, November 1, 2010

Subscribe to:
Posts (Atom)
