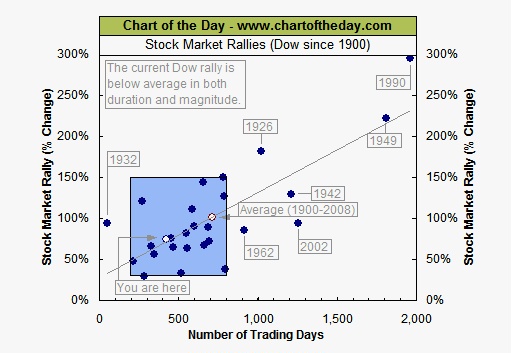
Each dot represents a major stock market rally as measured by the Dow.
As today's chart illustrates, the Dow has begun a major rally 27 times over the past 110 years which equates to an average of 1 rally every 4 years.
Also, most major rallies (73%) resulted in a gain of between +30% and +150% and lasted between 200 and 800 trading days -- highlighted in today's chart with a light blue shaded box.
As it stands right now, the current Dow rally (hollow blue dot labeled you are here) is still somewhat short in duration and below average in magnitude when compared to all the stock market rallies that occurred since 1900.
It is worth noting, however, that the current rally is in line with the more typical rallies (see light blue shaded box) of the past 110 years.
Chart & Commentary Courtesy of Chart of the Day

No comments:
Post a Comment