Monday, January 30, 2017
Vantage Point UPDATE: Intermediate-Term and Long-Term Trend Analysis
On Friday, January 27, the S&P 500 closed @ 2294, and that was...
+6.3% ABOVE its 12-Month moving average which stood @ 2158.
+6.3% ABOVE its 40-Week moving average which stood @ 2158.
+2.2% ABOVE its 10-Week moving average which stood @ 2244.
Therefore, the INTERMEDIATE-Term trend is BULLISH
and the LONG-Term trend is BULLISH.


Friday, January 27, 2017
Tips for Deducting More at Tax Time
Tax Deductions come in two basic types:
“Above-the-Line” and “Below-the-Line.”
The “Line” is your Adjusted Gross Income, or AGI.
Above-the-Line deductions are subtracted from your total income, thus lowering your AGI.
Another advantage is that many “Above-the-Line” deductions are allowed under the Alternative Minimum Tax, or AMT.
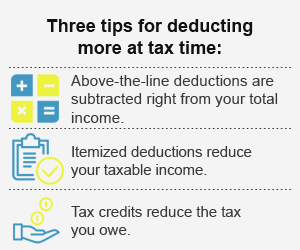
A lower AGI can potentially increase the value of your Below-the-Line itemized deductions, which often come with limits.
For example, you can deduct your medical and dental expenses, but only the amount that exceeds 10% of your AGI (7.5% if you or your spouse is 65 or older) and only if you itemize deductions on your federal tax return.
So the lower your AGI, the quicker you hit 10% and can start deducting.
You can’t claim these expenses if you take the standard deduction which, for 2016, is $6,300 for taxpayers who are single or married filing separately, $12,600 for married filing jointly, and $9,300 for heads of household (single taxpayers with dependents).
Wednesday, January 25, 2017

Monday, January 23, 2017
Vantage Point UPDATE: Intermediate-Term and Long-Term Trend Analysis
On Friday, January 20, the S&P 500 closed @ 2271, and that was...
+5.4% ABOVE its 12-Month moving average which stood @ 2154.
+5.4% ABOVE its 40-Week moving average which stood @ 2154.
+1.3% ABOVE its 10-Week moving average which stood @ 2243.
Therefore, the INTERMEDIATE-Term trend is BULLISH
and the LONG-Term trend is BULLISH.
Friday, January 20, 2017
Wednesday, January 18, 2017
Monday, January 16, 2017
Vantage Point UPDATE: Intermediate-Term and Long-Term Trend Analysis
On Friday, January 13, the S&P 500 closed @ 2275, and that was...
+5.6% ABOVE its 12-Month moving average which stood @ 2155.
+5.8% ABOVE its 40-Week moving average which stood @ 2150.
+1.9% ABOVE its 10-Week moving average which stood @ 2232.
Therefore, the INTERMEDIATE-Term trend is BULLISH
and the LONG-Term trend is BULLISH.
Friday, January 13, 2017
Social Security: Strategy #1: Maximize Lifetime Benefits
| Strategy No. 1: | Maximize Lifetime Benefits. |
A couple with similar incomes and ages may maximize lifetime benefits if both delay.
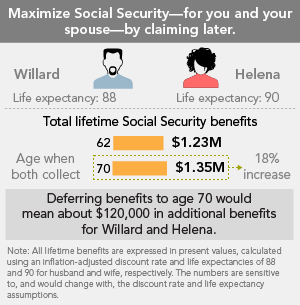
How it works: The basic principle is that the longer you defer your benefits, the larger they grow. Each year you delay Social Security from age 62 to 70 could increase your benefit by up to +8.0%.
Whom it may benefit: This strategy works best for couples with normal to high life expectancies with similar earnings, who are planning to work until age 70 or have sufficient savings to provide any needed income during the deferral period.
Example: Willard’s life expectancy is 88, and his income is $75,000. Helena’s life expectancy is 90, and her income is $70,000. They enjoy working. Suppose Willard and Helena both claim at age 62. As a couple, they would receive a lifetime benefit of $1,230,000. But if they live to be ages 88 and 90, respectively, deferring to age 70 would mean about $120,000 in additional benefits.
Learn More...
Read Viewpoints: “How the get the most from Social Security."- Watch Learning Center Video: Social Security: 5 key considerations to know before claiming your benefit.
- Visit the SSA website
 to request your Social Security statement, calculate your FRA, or estimate your future retirement, disability, or survivor benefits. You can also get additional information in the FAQ section.
 - Enter your estimated Social Security benefit information into the Fidelity Planning & Guidance Center to see how Social Security fits with your overall retirement plan.
Wednesday, January 11, 2017

Monday, January 9, 2017
Vantage Point UPDATE: Intermediate-Term and Long-Term Trend Analysis
On Friday, January 6, the S&P 500 closed @ 2277, and that was...
+5.7% ABOVE its 12-Month moving average which stood @ 2155.
+6.2% ABOVE its 40-Week moving average which stood @ 2144.
+2.9% ABOVE its 10-Week moving average which stood @ 2213.
Therefore, the INTERMEDIATE-Term trend is BULLISH
and the LONG-Term trend is BULLISH.
Friday, January 6, 2017
Wednesday, January 4, 2017
Monday, January 2, 2017
Vantage Point UPDATE: Intermediate-Term and Long-Term Trend Analysis
On Friday, December 30, the S&P 500 closed @ 2239, and that was...
+5.0% ABOVE its 12-Month moving average which stood @ 2133.
+4.7% ABOVE its 40-Week moving average which stood @ 2139.
+1.9% ABOVE its 10-Week moving average which stood @ 2198.
Therefore, the INTERMEDIATE-Term trend is BULLISH
and the LONG-Term trend is BULLISH.
Friday, December 30, 2016
The Percentage of Americans Participating in Encore Careers Might Surprise You...
Percentage of People Earning a Salary or Volunteering in Encore Careers
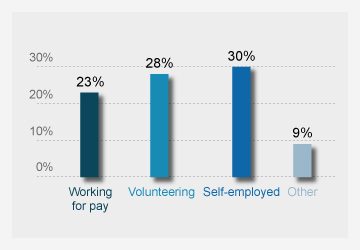
Source: Encore.org, 2014. Amounts that don’t add to 100% were either from people whose response was “don’t know” or, in some cases, it was due to rounding. Working for pay refers to people who were earning a wage or a salary. Self-employed refers to people who were working in for-profit businesses, such as entrepreneurs.
Wednesday, December 28, 2016

Monday, December 26, 2016
Vantage Point UPDATE: Intermediate-Term and Long-Term Trend Analysis
On Friday, December 23, the S&P 500 closed @ 2264, and that was...
+5.9% ABOVE its 12-Month moving average which stood @ 2138.
+5.8% ABOVE its 40-Week moving average which stood @ 2140.
+2.9% ABOVE its 10-Week moving average which stood @ 2201.
Therefore, the INTERMEDIATE-Term trend is BULLISH
and the LONG-Term trend is BULLISH.
Friday, December 23, 2016
The 1st Fed Rate Hike: 5 Charts Show the 1st Fed Rate Increase Has NOT Been A Showstopper for Investors
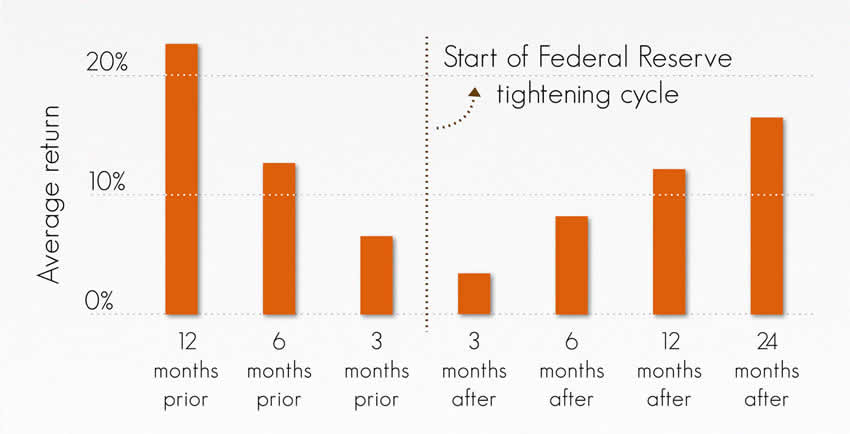
In 2016, for the first time in nearly 9 years, the Fed raised its short-term borrowing rate.
History may hold valuable clues for investors who are looking to understand what a rate hike may mean for them.
History may hold valuable clues for investors who are looking to understand what a rate hike may mean for them.
The bottom line is that while a rate hike may mark a turning point in policy and create volatility, it hasn’t historically been an inflection point for investment performance. Instead, the first rate hike has most often come during the mid-phase of the business cycle, a period when most investments have produced positive performance.
Here are some key lessons from the past, based on analysis from Fidelity’s Asset Allocation Research Team (AART). For all the charts that follow, it is worth noting that these results are averages, and in each instance of rate hikes, markets behave differently.
1. Stock gains continue after initial rate move.
While rate hikes may cause volatility, the first rate hike usually takes place during the mid-phase of the business cycle, when profits are strong and the economy is growing. Despite the rate hike, stocks have averaged double-digit gains in the year before and after the first Fed move.
Read the remainder of the report here...
Wednesday, December 21, 2016
Monday, December 19, 2016
Vantage Point UPDATE: Intermediate-Term and Long-Term Trend Analysis
On Friday, December 16, the S&P 500 closed @ 2258, and that was...
+5.7% ABOVE its 12-Month moving average which stood @ 2136.
+6.1% ABOVE its 40-Week moving average which stood @ 2129.
+3.8% ABOVE its 10-Week moving average which stood @ 2176.
Therefore, the INTERMEDIATE-Term trend is BULLISH
and the LONG-Term trend is BULLISH.
Friday, December 16, 2016
Wednesday, December 14, 2016
Monday, December 12, 2016
Vantage Point UPDATE: Intermediate-Term and Long-Term Trend Analysis
On Friday, December 9, the S&P 500 closed @ 2260, and that was...
+5.8% ABOVE its 12-Month moving average which stood @ 2136.
+6.1% ABOVE its 40-Week moving average which stood @ 2129.
+3.9% ABOVE its 10-Week moving average which stood @ 2175.
Therefore, the INTERMEDIATE-Term trend is BULLISH
and the LONG-Term trend is BULLISH.
Subscribe to:
Posts (Atom)
